The Performance of State's Economy
- Home
- Statistics
- Small Area Statistics
- The Performance of State's Economy
The Performance of State's Economy, 2017
Overview

INTRODUCTION
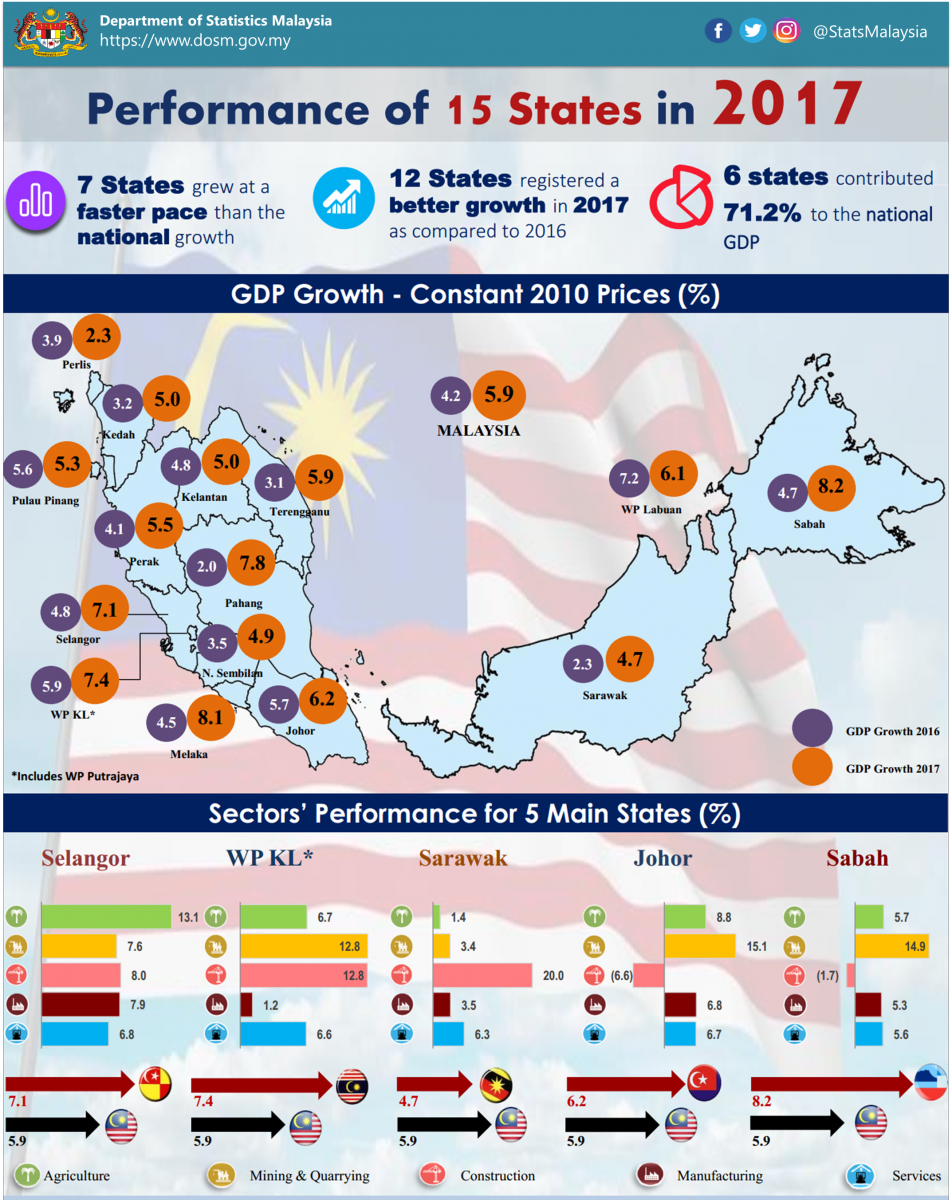
Malaysia's economic performance expanded to 5.9 per cent in 2017 as compared to 4.2 per cent in 2016. This performance was supported by a better growth recorded by most states in Malaysia. The growth was driven by the increase in manufacturing and services as well as rebound in the agriculture sector.
GDP CONTRIBUTION BY STATE
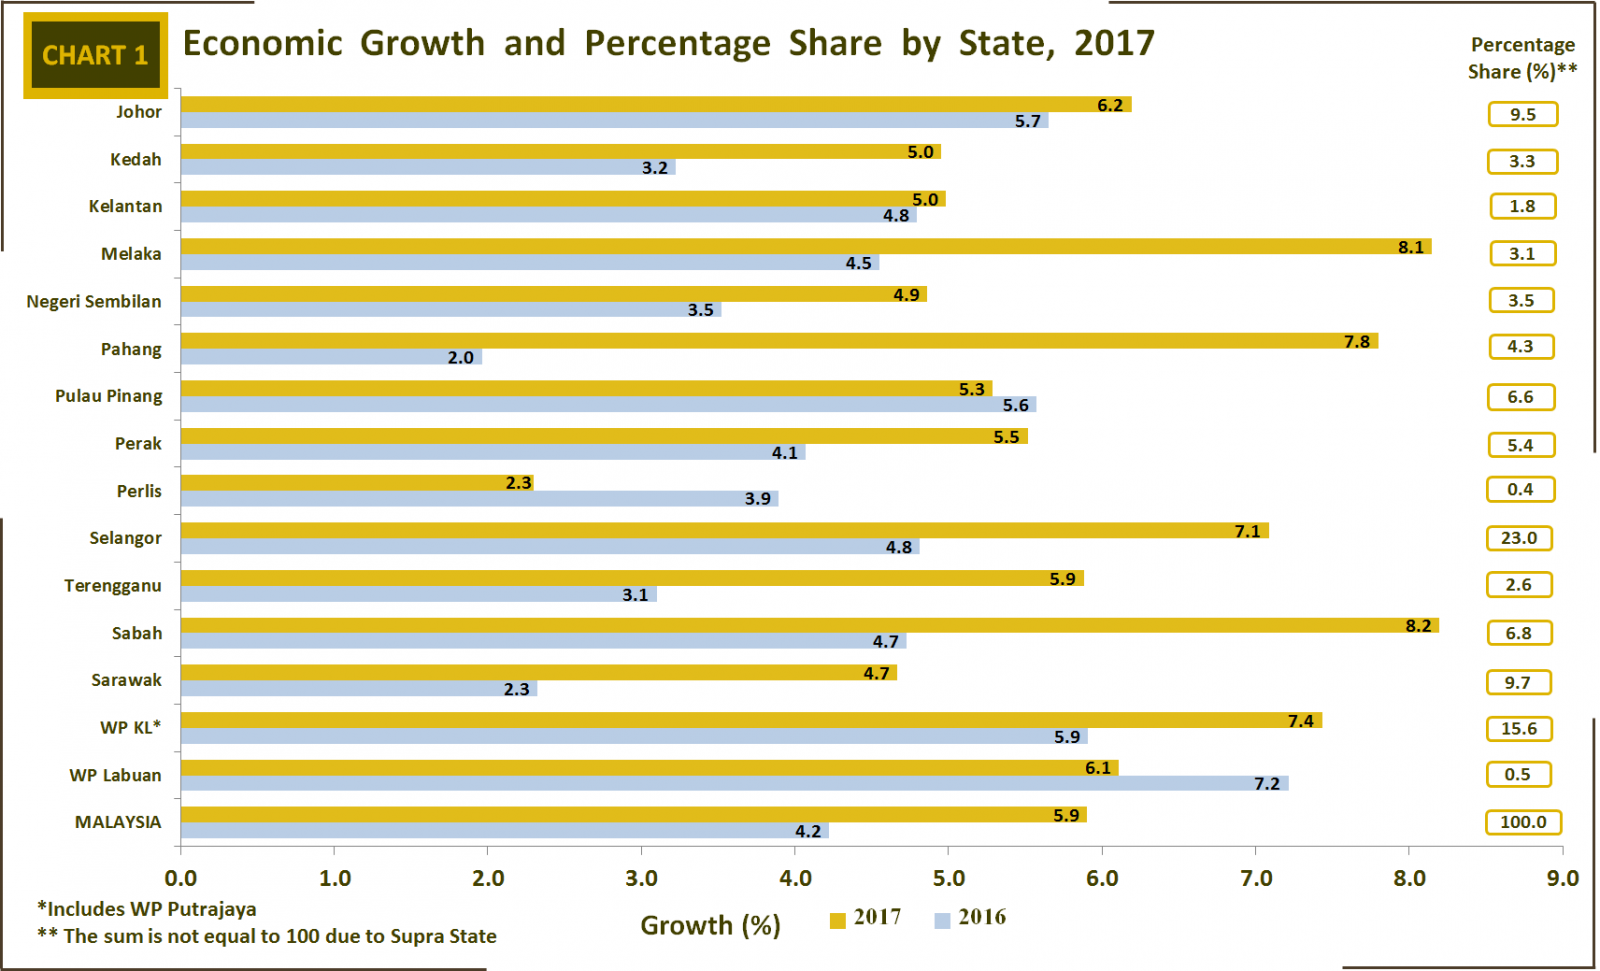
Six states contributed 71.2 per cent to the national GDP in 2017 as compared to 70.6 per cent in the previous year. Selangor recorded a contribution of 23.0 per cent followed by Wilayah Persekutuan Kuala Lumpur (WP KL) (15.6 per cent), Sarawak (9.7 per cent), Johor (9.5 per cent), Sabah (6.8 per cent) and Pulau Pinang (6.6 per cent) as shown in Chart 1.

ECONOMIC PERFORMANCE BY STATE
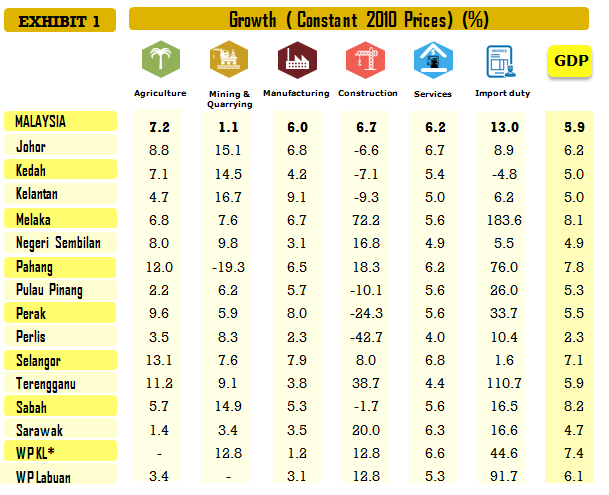
Seven states grew at a faster pace than the national growth (5.9%) in 2017 namely Sabah (8.2%), Melaka (8.1%), Pahang (7.8%), WP KL (7.4%), Selangor (7.1%), Johor (6.2%) and WP Labuan (6.1%). The performance for each state by the main sectors is shown in Exhibit 1.

*Includes WP Putrajaya
Johor recorded a growth of 6.2 per cent (2016: 5.7%) supported by services, manufacturing and agriculture sectors. Services sector expanded to 6.7 per cent (2016: 5.8%) driven by wholesale & retail trade, communication and transportation sub-sectors. Meanwhile, manufacturing sector posted a better growth of 6.8 per cent as compared to 5.5 per cent in 2016 attributed by electrical & electronics products. Agriculture sector elevated to 8.8 per cent (2016: -4.6%) stimulated by double-digit growth in the oil palm sub-sector. However, construction sector declined to negative 6.6 per cent as compared to 24.0 per cent in 2016.
Kedah stood at 5.0 per cent (2016: 3.2%) driven by services and agriculture sectors. Services sector recorded a growth of 5.4 per cent (2016: 5.3%) led by the wholesale & retail trade and communication sub-sectors. Agriculture sector surged to 7.1 per cent (2016: -8.7%) attributed by robust growth in the rubber and oil palm sub-sectors. Manufacturing sector moderated to 4.2 per cent as compared to 4.5 per cent in the previous year due to a slower growth momentum in the electrical & electronic products. In addition, construction sector recorded a negative growth of 7.1 per cent as compared to 15.9 per cent in 2016.
Kelantan grew 5.0 per cent in 2017 (2016: 4.8%) impelled by services, agriculture and manufacturing sectors. Services sector sustained at 5.0 per cent (2016: 5.0%) propelled by the wholesale & retail trade and communication sub-sectors. In addition, agriculture sector rose 4.7 per cent (2016: 2.9%) benefited from better growth in the rubber, oil palm and paddy sub-sectors. Sturdy growth in electrical & electronic products led manufacturing sector to surge to 9.1 per cent (2016: 2.1%). However, construction sector declined to negative 9.3 per cent compared to 29.6 per cent in the preceding year.
Melaka registered a vibrant growth of 8.1 per cent as compared to 4.5 per cent in 2016 influenced by a stronger performance in manufacturing, services and construction sectors. Manufacturing sector lifted up to 6.7 per cent (2016: 4.1%) backed by motor vehicles & transport equipment and electrical & electronic products. Services sector expanded to 5.6 per cent (2016: 5.1%) driven by wholesale & retail trade and communication activities. Construction sector stepped up to 72.2 per cent as compared to 5.6 per cent in 2016 supported by civil engineering sub-sector. In addition, agriculture sector increased to 6.8 per cent (2016: 3.7%) fuelled by palm oil and other livestock sub-sectors.
Negeri Sembilan increased 4.9 per cent as compared to 3.5 per cent in 2016. Services sector grew 4.9 per cent spearheaded by wholesale & retail trade and communication sub-sectors. However, the decline in the utilities sub-sector slowed down the overall momentum in services sector. Manufacturing sector grew 3.1 per cent (2016: 3.0%) influenced by a resilient growth in refined petroleum products. However, a contraction in electrical & electronic product has slowed down the overall manufacturing sector. Nevertheless, agriculture and construction sectors which registered 8.0 per cent and 16.8 per cent respectively have also influenced the overall performance of Negeri Sembilan’s economy.
Pahang recorded a robust growth of 7.8 per cent as compared to 2.0 per cent in 2016 was backed by services, agriculture and manufacturing sectors. Services sector grew to 6.2 per cent (2016: 5.4%) led by wholesale & retail trade and other services sub-sectors. Agriculture sector recovered to 12.0 per cent (2016: -6.1%) due to a favourable growth in the production of oil palm activity. In addition, manufacturing sector also recorded a better growth of 6.5 per cent as compared to 3.9 per cent in the previous year spurred by vegetable and animal oils & fats as well as chemicals & chemical products and motor vehicles & transport equipment activities.
Pulau Pinang registered a growth of 5.3 per cent (2016: 5.6%) reinforced by services and manufacturing sectors. Services sector sustained at 5.6 per cent driven by wholesale & retail trade, transportation and communication sub-sectors. Manufacturing sector grew by 5.7 per cent (2016: 5.4%) dominated by electrical & electronic products. Nevertheless, the negative 10.1 per cent (2016: 10.4%) in construction sector which resulted from the contraction in residential, non-residential and special trade activities has slowed down the overall economic performance of Pulau Pinang.
Perak inched up to 5.5 per cent from 4.1 per cent in 2016 underpinned by services, agriculture and manufacturing sectors. Services sector sustained at 5.6 per cent attributed by wholesale & retail trade, communication and utilities. Meanwhile, manufacturing sector expanded to 8.0 per cent (2016: 5.1%) impelled by electrical & electronics products, vegetable and animal oils & fats and motor vehicles & transport equipment activities. The increase in agriculture sector of 9.6 per cent (2016: -3.5%) was fuelled by palm oil and rubber activities.
Perlis recorded a growth of 2.3 per cent (2016: 3.9%) attributed by services and agriculture sectors. The growth of 4.0 per cent in services sector was spearheaded by wholesale & retail trade and communication sub-sectors. However, the contraction in utilities sub sector has slowed down the services sector. Agriculture sector continued to record a positive growth from 2.9 per cent to 3.5 per cent supported by a better performance in rubber sub-sector. However, the decline in construction sector to negative 42.7 per cent (2016: 9.8 per cent) has weighed down the overall economic performance of Perlis.
Selangor remained substantial at a growth of 7.1 per cent (2016: 4.8%) stimulated by services and manufacturing sectors. Services sector grew to 6.8 per cent (2016: 6.0 per cent) supported by finance & insurance, wholesale & retail trade, communication, real estate and business services sub-sectors. The growth of 7.9 per cent (2016: 4.3%) in manufacturing sector was driven by electrical & electronic products and motor vehicles & transport equipment sub-sectors. The increase in oil palm production and fisheries activities has stimulated the better growth in agriculture sector to 13.1 per cent (2016: -6.4 %) while the growth of 8.0 per cent (2016: -2.0%) in construction sector was contributed by civil engineering sub sector.
Terengganu registered 5.9 per cent (2016: 3.1%) supported by the increase in services, construction and agriculture. Services sector rose to 4.4 per cent (2016: 1.7%) contributed by wholesale & retail trade and communication activities, while construction sector elevated to 38.7 per cent (2016: 2.0%) fuelled by civil engineering and residential activities. Besides, the increase in agriculture sector to 11.2 per cent (2016: -6.1%) was influenced by a better growth in rubber and oil palm activities. Nevertheless, manufacturing sector slowed down to 3.8 per cent as compared to 7.3 per cent in the previous year due to a slower growth in chemicals and chemical products.
Sabah recorded a strong momentum of 8.2 per cent as compared in 2016 attributed by agriculture, mining & quarrying and manufacturing. Agriculture escalated to 5.7 per cent (2016: -11.1%) aided by the recovery in oil palm and rubber. The growth of 14.9 per cent (2016: 20.6%) in mining & quarrying was influenced by production of crude petroleum and natural gas. Furthermore, manufacturing sector expanded to 5.3 per cent (2016: -3.7%) supported by vegetable and animal oils & fats activity. Services sector recorded 5.6 per cent contributed by wholesale & retail trade and communication activities. However, construction sector declined to negative 1.7 per cent (2016: -3.2%) due to civil engineering sub-sectors.
Sarawak registered a growth of 4.7 per cent (2016: 2.3%) influenced by mining & quarrying and construction sector. Mining & quarrying sector expanded to 3.4 per cent (2016: -2.8%) supported by a positive growth in the natural gas production. The increase in civil engineering and residential buildings contributed to the growth of 20.0 per cent (2016: -5.1%) in construction sector. Services sector grew 6.3 per cent (2016: 6.7%) contributed by wholesale & retail trade, transportation and finance & insurance. The slower growth of 3.5 per cent (2016: 4.5%) in manufacturing sector was due to refined petroleum products. Agriculture sector grew 1.4 per cent (2016: -2.5%) influenced by oil palm subsector.
W.P. Kuala Lumpur recorded a growth of 7.4 per cent (2016: 5.9%) fuelled by services and construction sector. Services sector grew to 6.6 per cent (2016: 5.5%) supported by wholesale & retail trade, finance & insurance, communication and professional. Besides, the growth of 12.8 per cent in construction sector which contributed by residential buildings, civil engineering and special trade also stimulated the overall economic growth of W.P. Kuala Lumpur.
W.P Labuan posted 6.1 per cent (2016: 7.2%) backed by services sector which increased to 5.3 per cent (2016: 8.2%). The growth was dominated by finance and insurance sub-sector. In addition, manufacturing sector eased to 3.1 per cent (2016: 7.6%) affected by basic metal and chemicals & chemical products.
TABLE THE PERFORMANCE OF STATE'S ECONOMY ![]()
Released By:
THE OFFICE OF CHIEF STATISTICIAN MALAYSIA
DEPARTMENT OF STATISTICS, MALAYSIA
8 May 2018
Contact person:
Ho Mei Kei
Public Relation Officer
Strategic Communication & International Division
Department of Statistics, Malaysia
Tel : +603-8885 7942
Fax : +603-8888 9248
Email : mkho[at]dosm.gov.my
Subscribe
Newsletter
Subscribe to our newsletter and stay updated
For interviews, press statement and clarification to the media, contact:
Baharudin Mohamad
Public Relation Officer
Email: baharudin[at]dosm.gov.my
Phone: 03 8090 4681
Not found what you looking for? Request data from us, through
Go to eStatistik
Email: data[at]dosm.gov.my
Phone: 03 8885 7128 (data request)


