Gross Fixed Capital Formation
- Home
- Statistics
- Economy
- National Accounts
- Gross Fixed Capital Formation
Gross Fixed Capital Formation 2020
Gross Fixed Capital Formation 2019 23 July 2019
Gross Fixed Capital Formation 2018 25 July 2018
Gross Fixed Capital Formation 2010 - 2017 26 July 2017
Gross Fixed Capital Formation 2010 - 2016 29 July 2016
Gross Fixed Capital Formation 2010 - 2015 20 August 2015
Gross Fixed Capital Formation 2010 - 2014 Show all release archives
Overview

GROSS FIXED CAPITAL FORMATION 2020
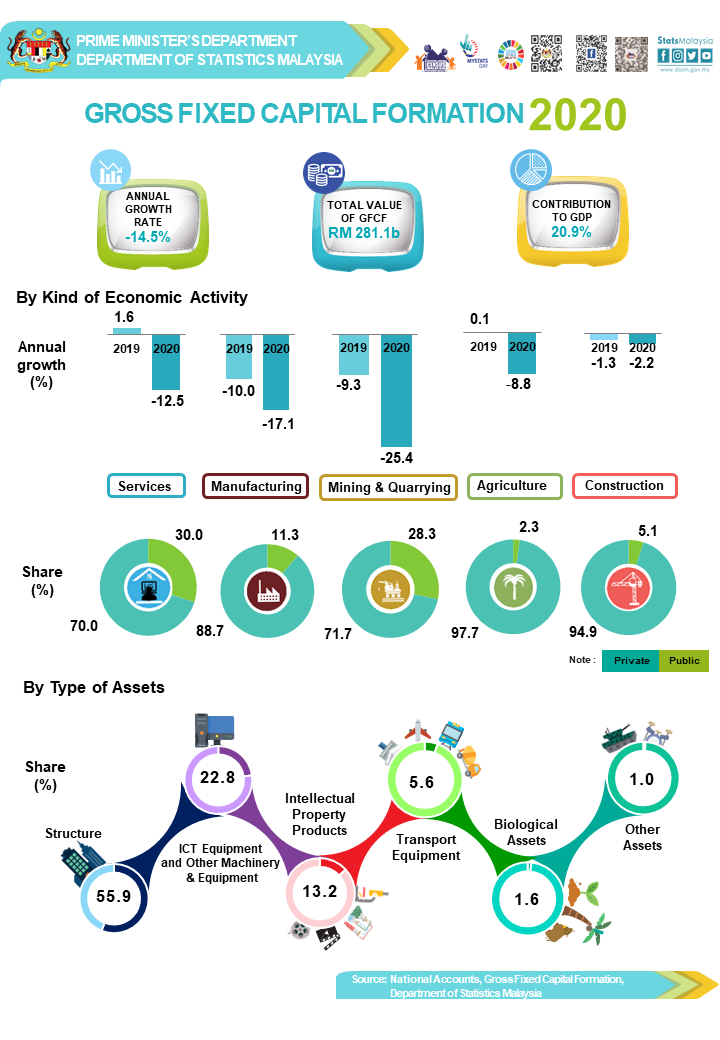
Malaysia’s Gross Fixed Capital Formation (GFCF) growth contracted 14.5 per cent in 2020 as compared to negative 2.1 per cent in the preceding year attributed the COVID-19 pandemic which has affected the performance of all economic activities (Chart 1). This was the biggest contraction since the Asian Financial Crisis whereby GFCF declined 43.0 per cent in 1998. The reduction in investments will lead to a lower production capacity in the future and thus have implications for potential output. GFCF remained as the second largest component in Gross Domestic Product (GDP) with a share of 20.9 per cent (2019: 23.1%) from the overall economy as shown in Chart 2. The fixed asset investment continuously led by Private sector. Meanwhile, Structure was the main contributor for GFCF by types of assets.
Chart 1: GFCF - Value and Annual Percentage Change at Current Prices and Constant 2015 Prices

Chart 2: Percentage Share of GDP by Expenditure Approach at Constant 2015 Prices

GFCF BY KIND OF ECONOMIC ACTIVITY
GFCF further dropped to 14.5 per cent from negative 2.1 per cent in the preceding year (Exhibit 1) due to the lethargic performance in all sectors in 2020.
Exhibit 1: GFCF by Kind of Economic Activity at Constant 2015 Prices

GFCF in Services sector contracted to 12.5 per cent (2019: 1.6%) influenced by the decline in the performance of Transportation & storage and information & communication and Finance, insurance, real estate & business services at negative 24.9 per cent and negative 10.9 per cent. On the other hand, Food & beverages and accommodation posted a growth of 0.5 per cent as compared to the preceding year.
GFCF in Manufacturing sector dropped by 17.1 per cent as against a decline of 10.0 per cent in the previous year. The sluggish performance was attributed by Petroleum, chemical, rubber and plastic products which recorded a decrease of 24.4 per cent. Electrical, electronic & optical products and transport equipment has also weighed down the overall performance of Manufacturing by contracting 17.2 per cent (2019: -6.8%). Moreover, Non-metallic mineral products, basic metal and fabricated metal products and Textiles & wood products declined 15.1 per cent (2019: -7.2%) and negative 7.8 per cent (2019: -7.5%) respectively.
Mining and quarrying sector declined by 25.4 per cent from a decrease of 9.3 per cent in the preceding year. Agriculture sector also contracted 8.8 per cent (2019: 0.1%) attributed to the weakened performance in all sub-sectors. Meanwhile Construction sector decreased by 2.2 per cent in 2020, steeper than the decline of 1.3 per cent recorded in the previous year.
GFCF BY TYPE OF ASSETS
Structure remained as the major contributor to GFCF with a share of 55.9 per cent, although it declined 18.3 per cent (2019: -0.5%) in 2020 compared with a year a go. Furthermore, ICT equipment and other machinery & equipment dropped to 8.9 per cent (2019: -4.1%), while Intellectual property products grew marginally at 0.6 per cent (2019: 2.2%).
Exhibit 2: Percentage Share of GFCF by Type of Assets at Constant 2015 Prices

GFCF BY SECTOR AND KIND OF ECONOMIC ACTIVITY
Private sector continued to be the dominant contributor to GFCF (share: 74.9%) declined 11.9 per cent as compared to 1.6 per cent in 2019. Public sector (share: 25.1%) also showed a similar downward trend by recording a further decrease of 21.3 per cent in 2020 as illustrated in Exhibit 3.
Exhibit 3: Percentage Share of GFCF by Sector at Constant 2015 Prices

Chart 3: Percentage Share of GFCF by Sector and Kind of Economic Activity at Constant 2015 Prices

Services and Manufacturing activities were the main contributors in GFCF of Private sector as depicted in Chart 3. The share of Services activity stepped-up to 62.9 per cent (2019: 61.5%) while Manufacturing activity maintained its position as the second largest contributor with a share of 20.9 per cent (2019: 22.1%). The remaining activities made-up 16.2 per cent of the total Private sector of GFCF.
GFCF of Public sector was largely dominated by Services activity with a highest share of 80.6 per cent. This was followed by Mining & quarrying and Manufacturing activities at 10.7 per cent and 7.9 per cent share respectively.
The full publication of Gross Fixed Capital Formation (GFCF) 2020 can be downloaded through eStatistik portal.
Released By:
DATO' SRI DR. MOHD UZIR MAHIDIN
CHIEF STATISTICIAN MALAYSIA
DEPARTMENT OF STATISTICS, MALAYSIA
![]() DrUzir_Mahidin
DrUzir_Mahidin ![]()
![]() Dr_Uzir
Dr_Uzir
26 July 2021
Contact person:
Mohd Yusrizal Ab Razak
Public Relation Officer
Strategic Communication and International Division
Department of Statistics, Malaysia
Tel : +603-8885 7942
Fax : +603-8888 9248
Email : yusrizal.razak[at]dosm.gov.my
Subscribe
Newsletter
Subscribe to our newsletter and stay updated
For interviews, press statement and clarification to the media, contact:
Baharudin Mohamad
Public Relation Officer
Email: baharudin[at]dosm.gov.my
Phone: 03 8885 7942
Not found what you looking for? Request data from us, through
Go to eStatistik
email to data[at]dosm.gov.my
call 03 8885 7128 (data request)


