
Gross Domestic Product
- Home
- Statistics
- Economy
- National Accounts
- Gross Domestic Product
Gross Domestic Product Third Quarter of 2015
Gross Domestic Product Second Quarter of 2015 15 May 2015
Gross Domestic Product First Quarter Of 2015 12 February 2015
Gross Domestic Product Fourth Quarter Of 2014 16 May 2014
GDP BY STATES 2005-2013 16 May 2014
GDP BY STATES 2005-2013 16 May 2014
GDP BY STATES 2005-2013 Show all release archives
Overview
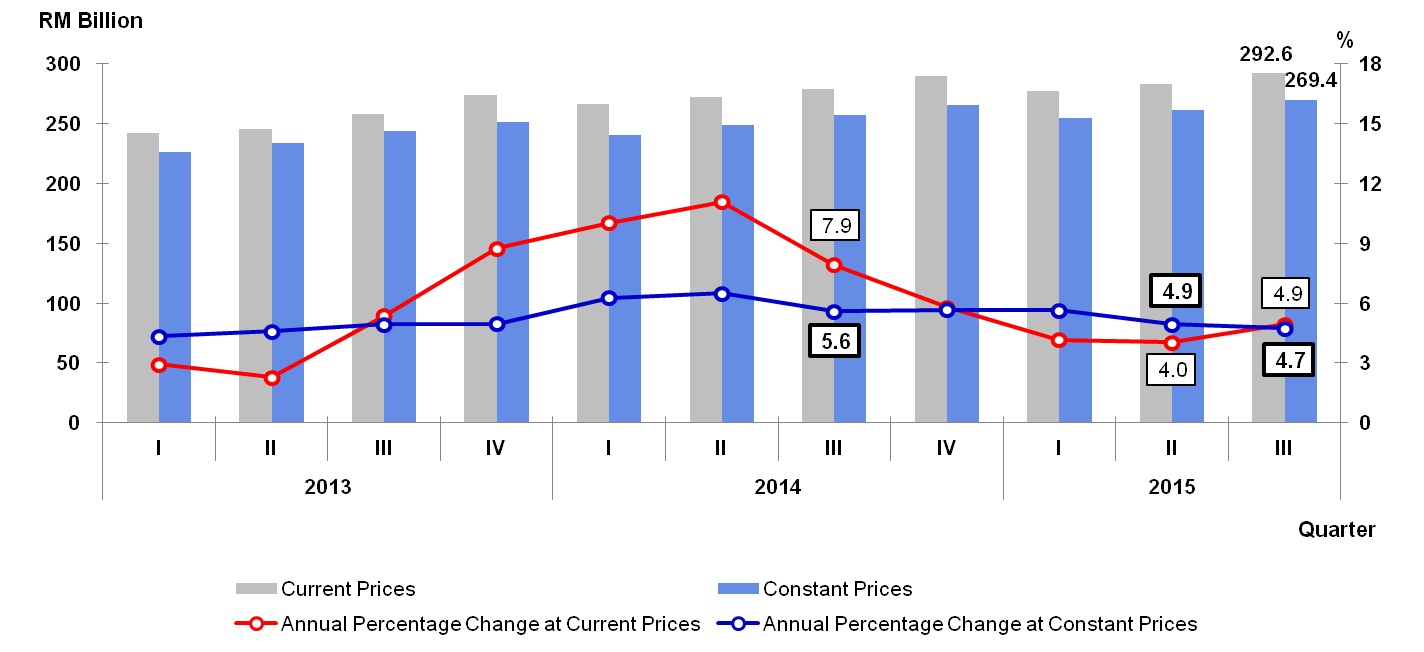
Malaysia’s economy grew 4.7 per cent in the third quarter of 2015 (Q2 2015: 4.9%). The quarter-on-quarter seasonally adjusted Gross Domestic Product (GDP) increased 0.7 per cent from 1.1 per cent in the preceding quarter.
For the three quarters of 2015, GDP posted a growth of 5.1 per cent with a value of RM853.0 billion at current and RM784.9 billion at constant prices.
| PERCENTAGE CHANGE FROM CORRESPONDING QUARTER OF PRECEDING YEAR | |||||||
| Q1 2014 | Q2 2014 | Q3 2014 | Q4 2014 | Q1 2015 | Q2 2015 | Q3 2015 | |
| GDP | 6.3 | 6.5 | 5.6 | 5.7 | 5.6 | 4.9 | 4.7 |
| PERCENTAGE CHANGE FROM PRECEDING QUARTER | |||||||
| Seasonally Adjusted GDP | 1.4 | 1.6 | 0.8 | 1.8 | 1.2 | 1.1 | 0.7 |
Chart 1: GDP - Value Added and Annual Percentage Change
|
Chart 2: Services - Value Added and Annual Percentage Change
|
Services sector grew 4.4 per cent as compared with 5.0 per cent in second quarter of 2015. Wholesale & Retail Trade continued to drive the Services sector by registering a growth of 5.7 per cent. The sturdy momentum in data communication activities has spurred Information & Communication sub-sector to increase 9.5 per cent. Meanwhile, Business Services augmented to 7.6 per cent boosted by the better performance in professional activities. |
|
|
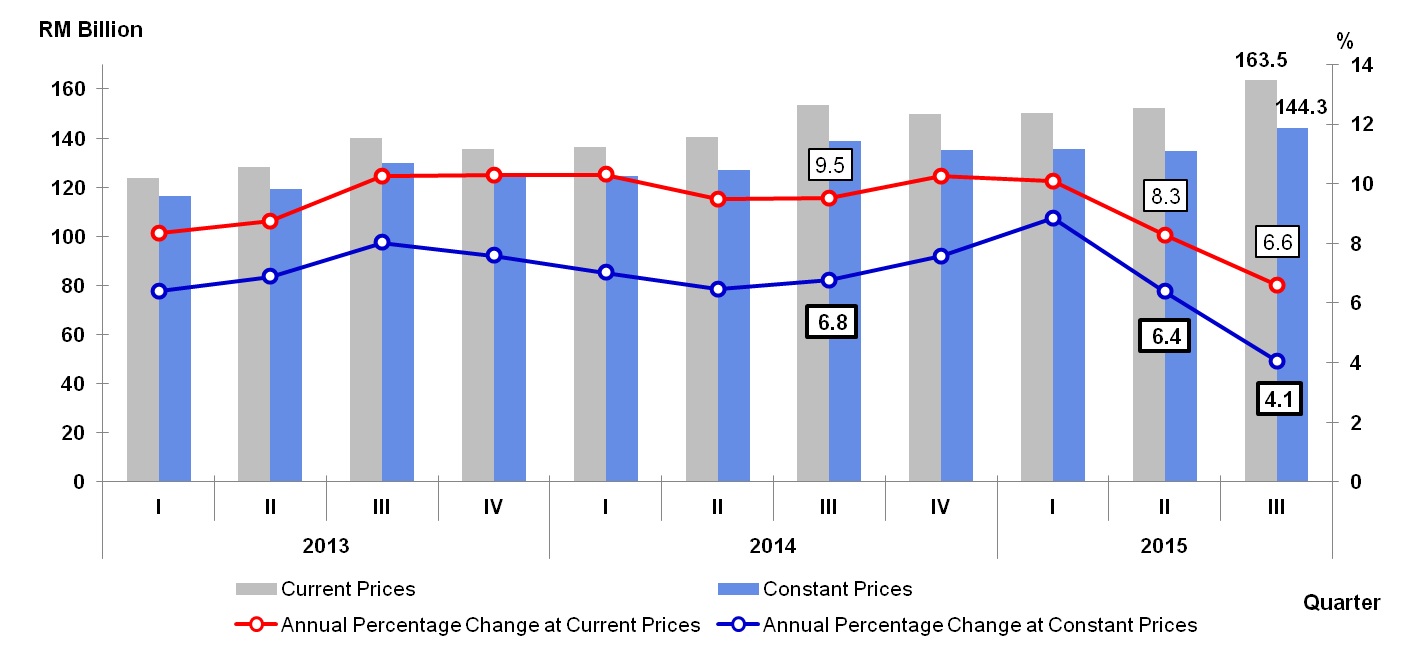
Chart 3: Manufacturing - Value Added and Annual Percentage Change
|
Manufacturing sector rose to 4.8 per cent from 4.2 per cent in the preceding quarter. The better performance of Manufacturing sector was underpinned by Electrical, Electronic & Optical products (10.3%), particularly in manufacture of consumer electronics, printed circuit boards and computer peripheral equipment. Petroleum, Chemical, Rubber & Plastic products (share: 31.0%) continued to support Manufacturing sector by registering a growth of 2.4 per cent. |
|
|
Chart 4: Mining & Quarrying - Value Added and Annual Percentage Change
|
Mining and Quarrying sector which accounted for 8.3 per cent of Malaysia's economy, eased to 5.3 per cent (Q2 2015: 6.0%). The moderation was largely due to the lower production of crude oil despite a rebound in production of natural gas and condensate. |
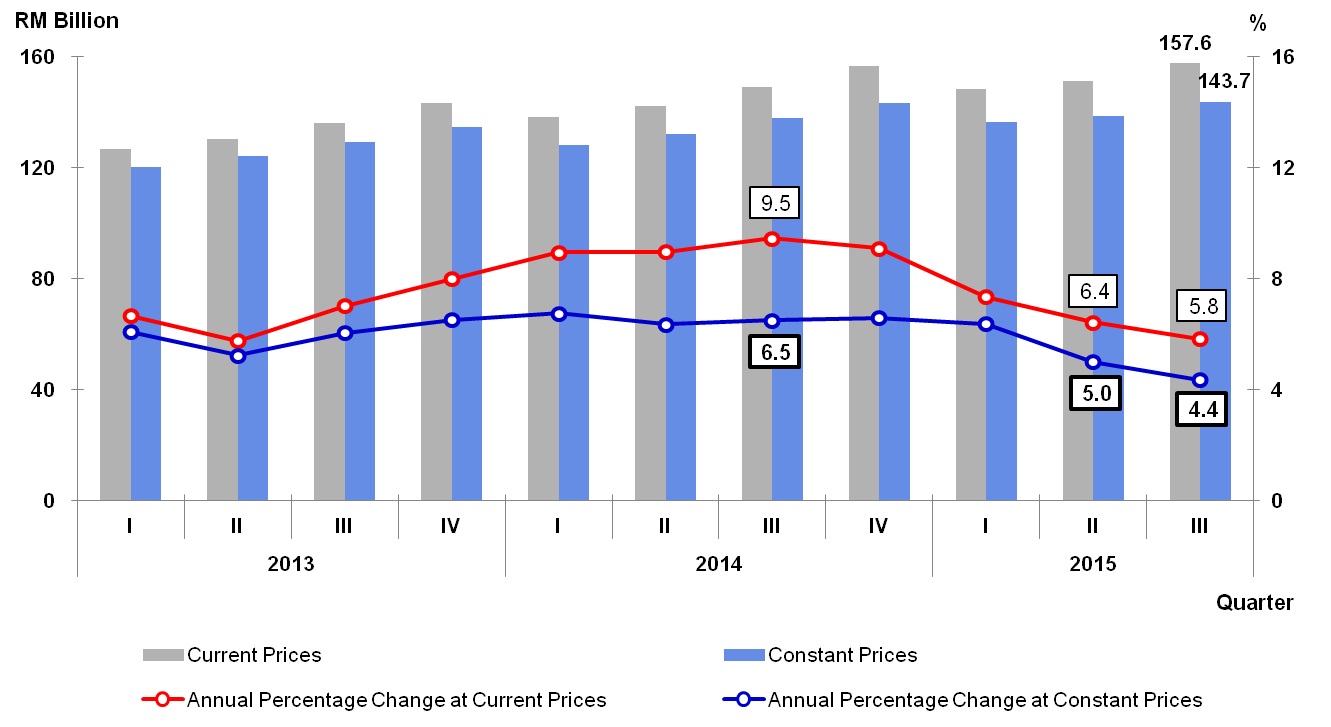

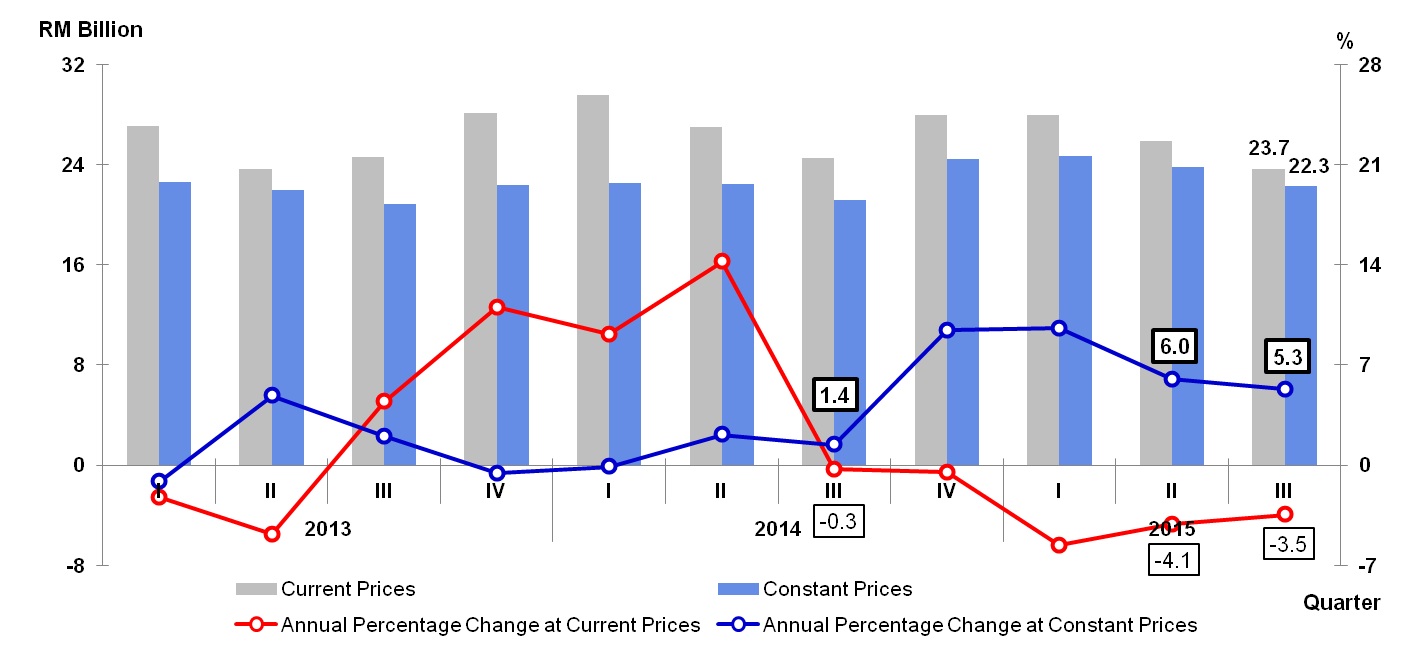
Chart 5: Private Final Consumption Expenditure – Value and Annual Percentage Change
Private Final Consumption Expenditure posted a growth of 4.1 per cent (Q2 2015: 6.4%). The growth was underpinned by consumption on food & beverages, transportation and communication.
|
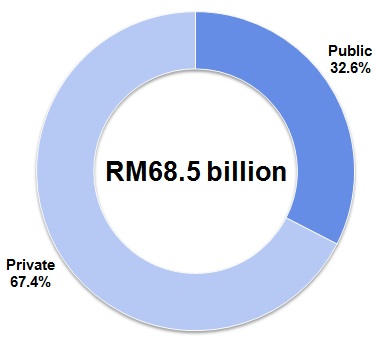
Chart 6: GFCF – Value and Percentage Share at Constant 2010 prices
|
Gross Fixed Capital Formation (GFCF) grew at a higher rate of 4.2 per cent from 0.5 per cent in second quarter of 2015. The growth of GFCF was stimulated by Structure (7.0%) which was in line with the performance of the Construction sector. Private sector (share: 67.4%) rose to 5.5 per cent and Public sector rebounded to 1.8 per cent (Q2 2015: -8.0%). |
|
|
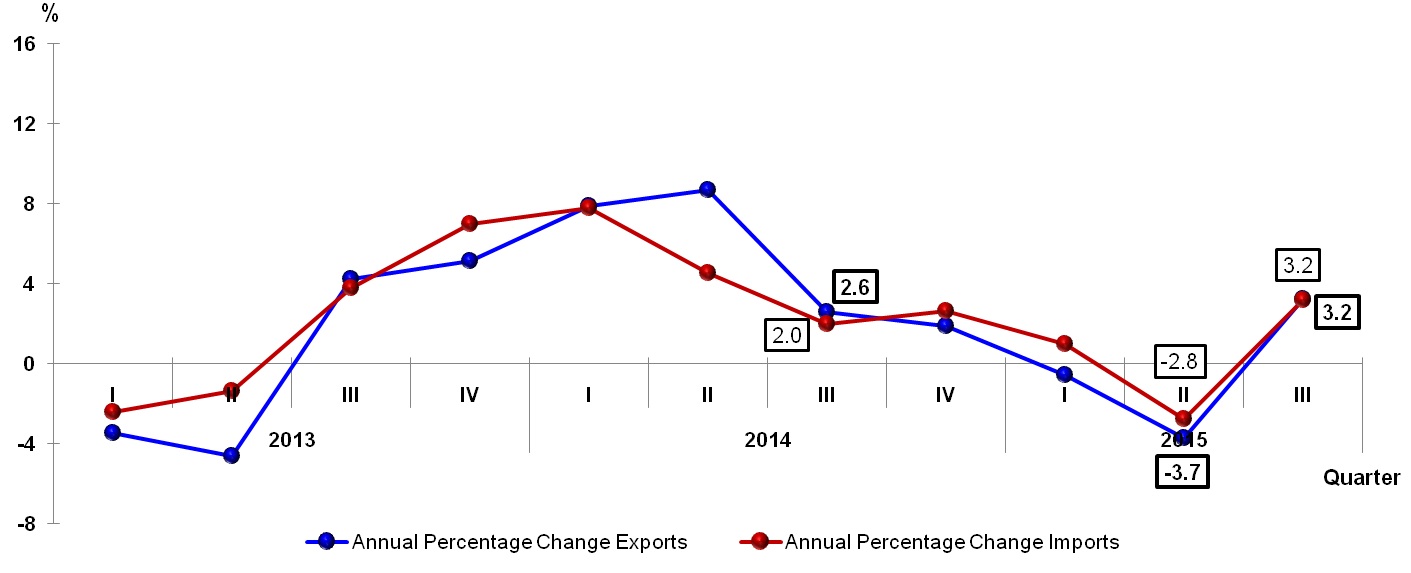
Chart 7: Exports & Imports - Annual Percentage Change
|
Exports posted a growth of 3.2 per cent, reversing from 3.7 per cent decline in the second quarter of 2015. Imports turned around to 3.2 per cent from negative 2.8 per cent. |
Released By:
THE OFFICE OF CHIEF STATISTICIAN MALAYSIA
DEPARTMENT OF STATISTICS, MALAYSIA
13 November 2015
Contact person:
Norrita binti Amran
Public Relation Officer
Corporate and User Services Division
Department of Statistics, Malaysia
Tel : +603-8885 7942
Fax : +603-8888 9248
Email : norrita.amran@stats.gov.my
Subscribe
Newsletter
Subscribe to our newsletter and stay updated
For interviews, press statement and clarification to the media, contact:
Baharudin Mohamad
Public Relation Officer
Email: baharudin[at]dosm.gov.my
Phone: 03 8885 7942
Not found what you looking for? Request data from us, through
Go to eStatistik
email to data[at]dosm.gov.my
call 03 8885 7128 (data request)


