
Gross Domestic Product
- Home
- Statistics
- Economy
- National Accounts
- Gross Domestic Product
Gross Domestic Product Second Quarter of 2015
Overview
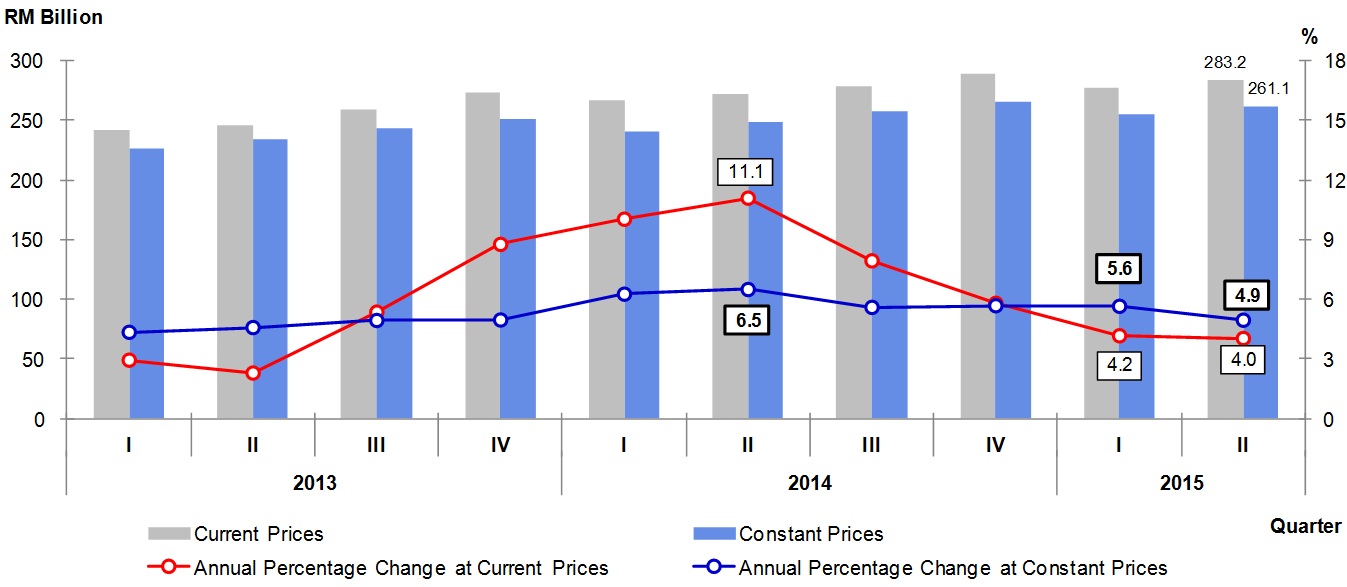
Malaysia’s economy registered a growth of 4.9 per cent in the second quarter of 2015. On a quarter-on-quarter seasonally adjusted, the economy expanded to 1.1 per cent.
For the first half of 2015, GDP expanded 5.3 per cent (1H 2014: 6.4%). During the period, GDP recorded a value of RM515.5 billion at constant prices and RM560.5 billion at current prices.
| PERCENTAGE CHANGE FROM CORRESPONDING QUARTER OF PRECEDING YEAR | ||||||
| Q114 | Q214 | Q314 | Q414 | Q115 | Q215 | |
| GDP | 6.3 | 6.5 | 5.6 | 5.7 | 5.6 | 4.9 |
| PERCENTAGE CHANGE FROM PRECEDING QUARTER | ||||||
| Seasonally Adjusted GDP | 1.4 | 1.6 | 0.8 | 1.8 | 1.2 | 1.1 |
Chart 1: GDP - Value Added and Annual Percentage Change
|
Chart 2: Services - Value Added and Annual Percentage Change
|
Services sector grew at 5.0 per cent underpinned by Wholesale & Retail Trade and Information & Communication. The growth of 5.9 per cent in Wholesale & Retail Trade was supported by Wholesale segment which rose to 8.7 per cent in this quarter. Information & Communication remained favourable at 9.3 per cent, attributed by the sturdy momentum in communication. The steady performance in professional activities has led the growth in Business Services to increase at 6.8 per cent. |
|
|
Chart 3: Manufacturing - Value Added and Annual Percentage Change
|
Manufacturing sector grew at a moderate pace of 4.2 per cent (Q1 2015: 5.6%). The growth for this sector was supported by Electrical, Electronic & Optical products (share: 24.7%) which increased to 4.5 per cent. This was backed by the strong momentum in consumer electronics and a rebound in computer equipment. Higher production in chemicals & chemical products and a recovery in production of rubber products has induced the Petroleum, Chemical, Rubber & Plastic products to register a growth of 3.5 per cent. |
|
|
Chart 4: Mining & Quarrying - Value Added and Annual Percentage Change
|
Mining and Quarrying sector which accounted for 9.1 per cent of Malaysia’s economy, moderated to 6.0 per cent (Q1 2015: 9.6%). The slower growth in this quarter was influenced by the decline in production of natural gas and moderation in production of crude oil. |
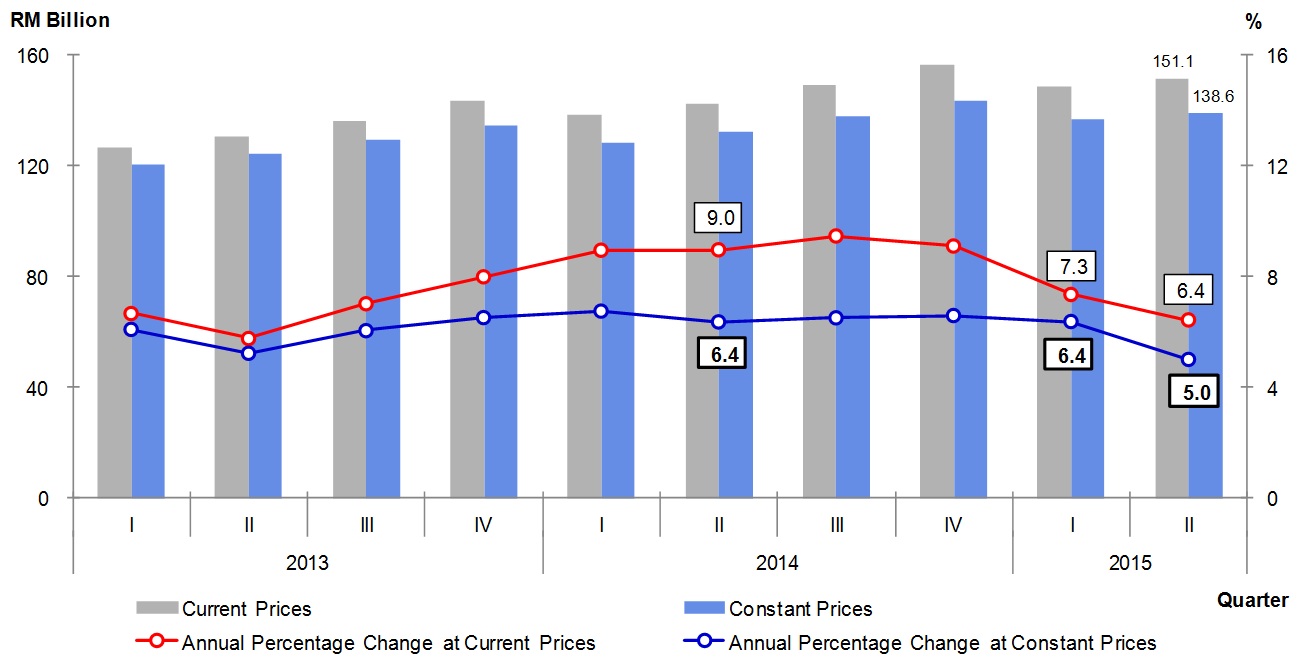
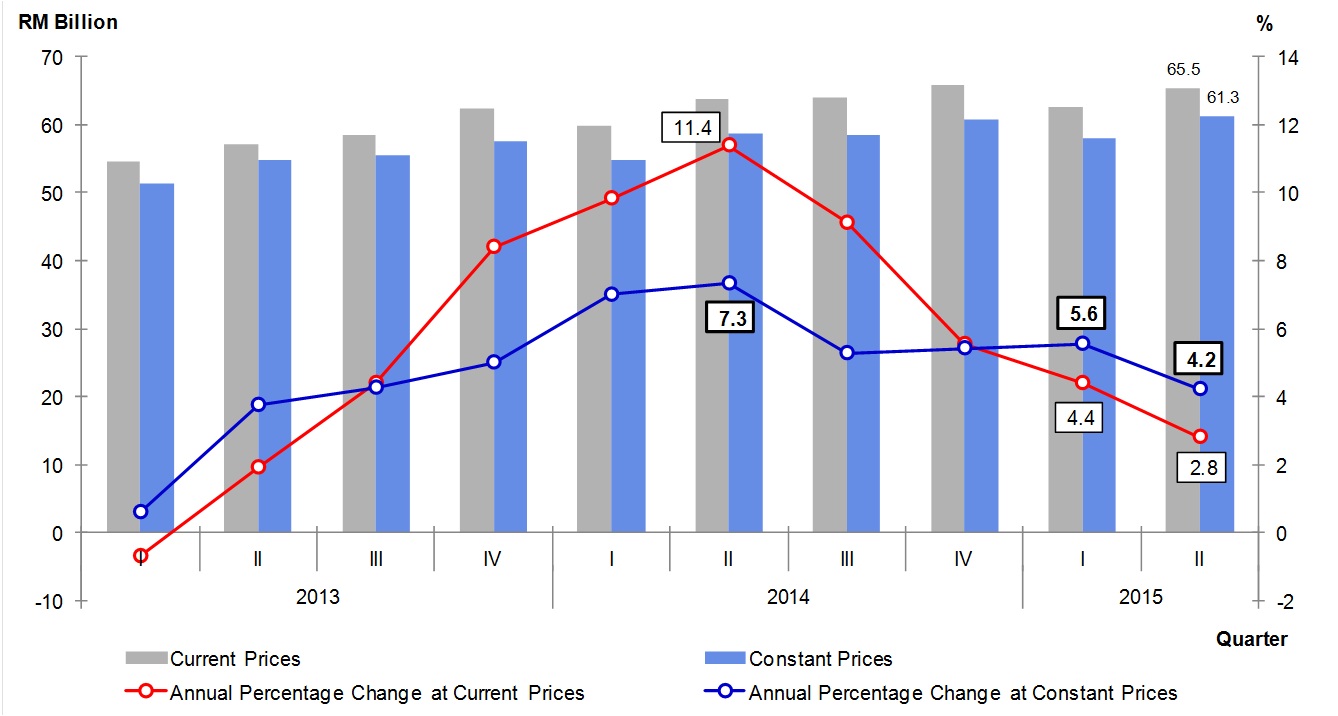
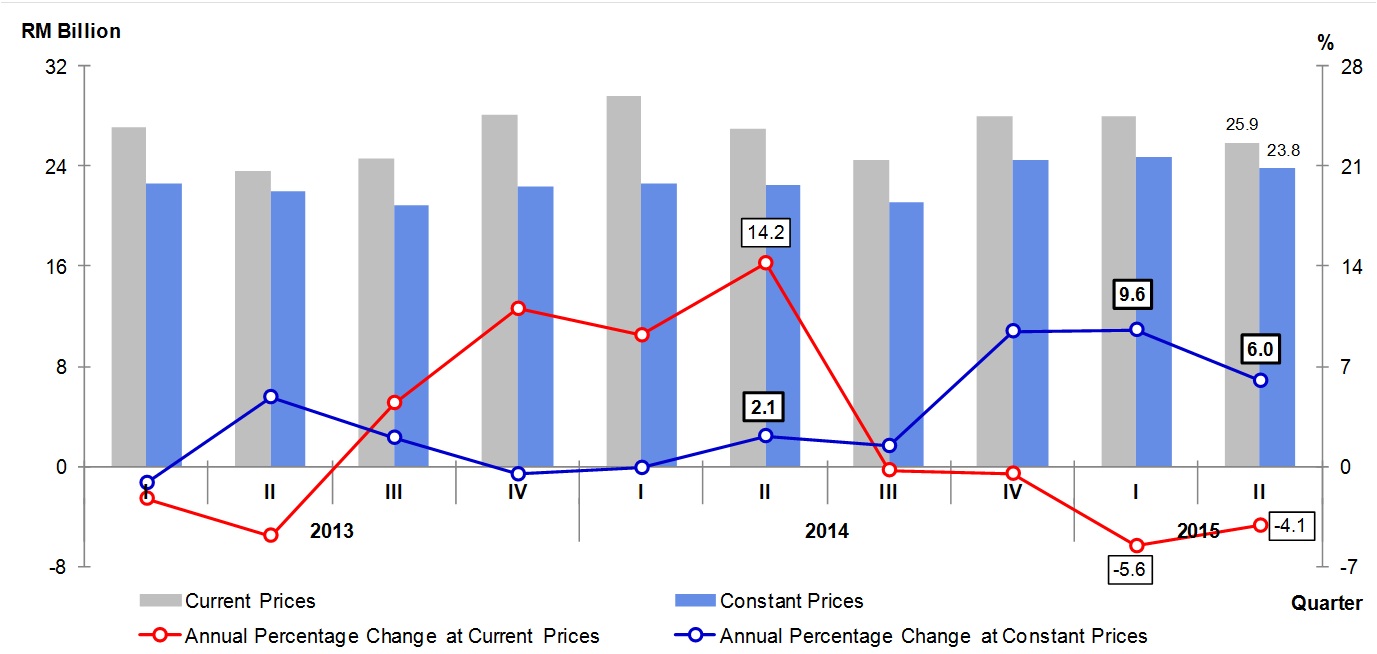
Chart 5: Private Final Consumption Expenditure – Value and Annual Percentage Change
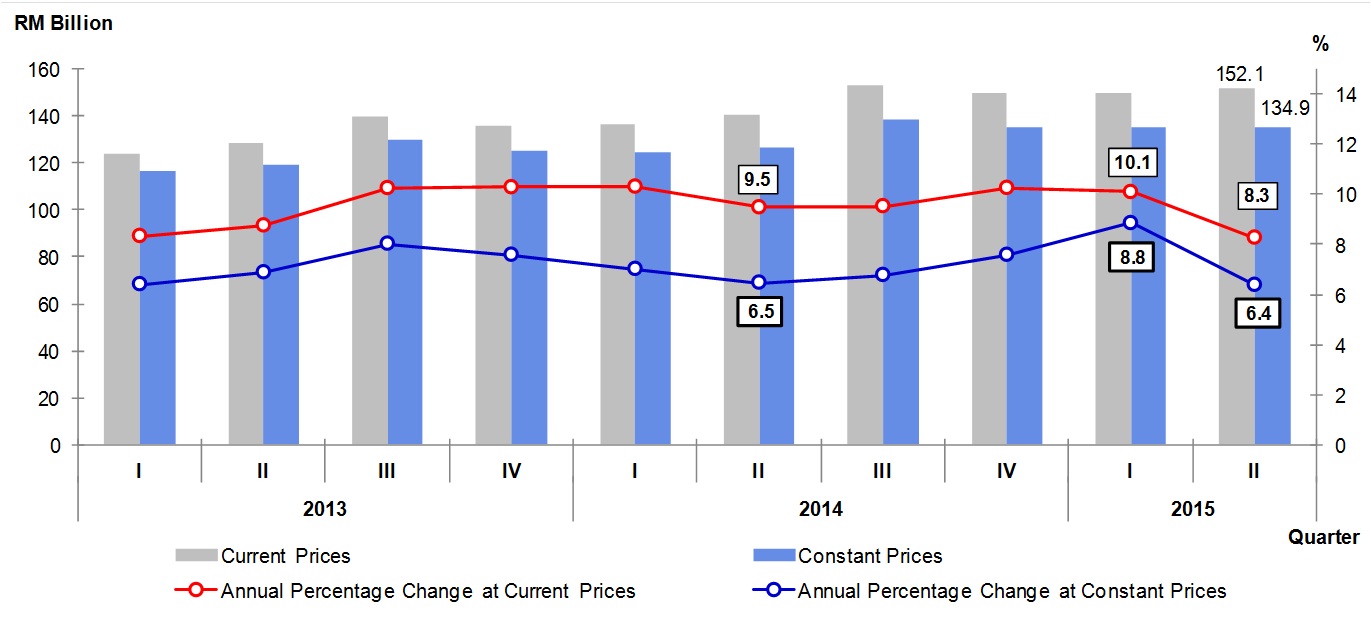
Private Final Consumption Expenditure grew at 6.4 per cent (Q1 2015: 8.8%). The growth was driven by the consumption on food & beverages, housing & utilities, communication and transportation.
|
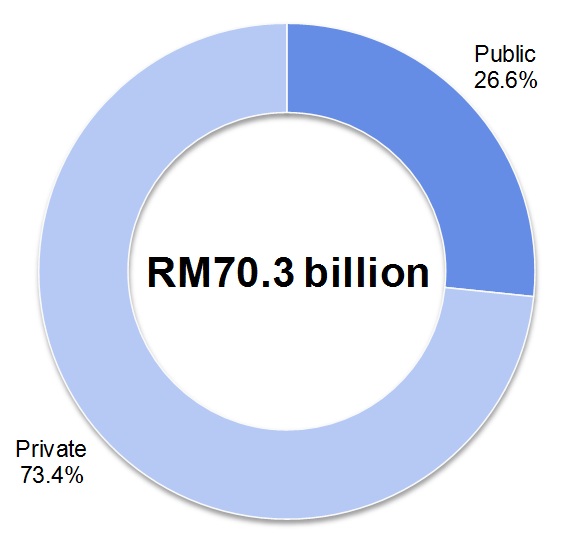
Chart 6: GFCF – Value and Percentage Share at Constant 2010 prices
|
Gross Fixed Capital Formation (GFCF) eased to 0.5 per cent (Q1 2015: 7.9%) due to the deceleration in Machinery & Equipment at a negative 7.5 per cent. The momentum of GFCF was led by Private sector (share: 73.4%) which grew at 3.9 per cent. |
|
|
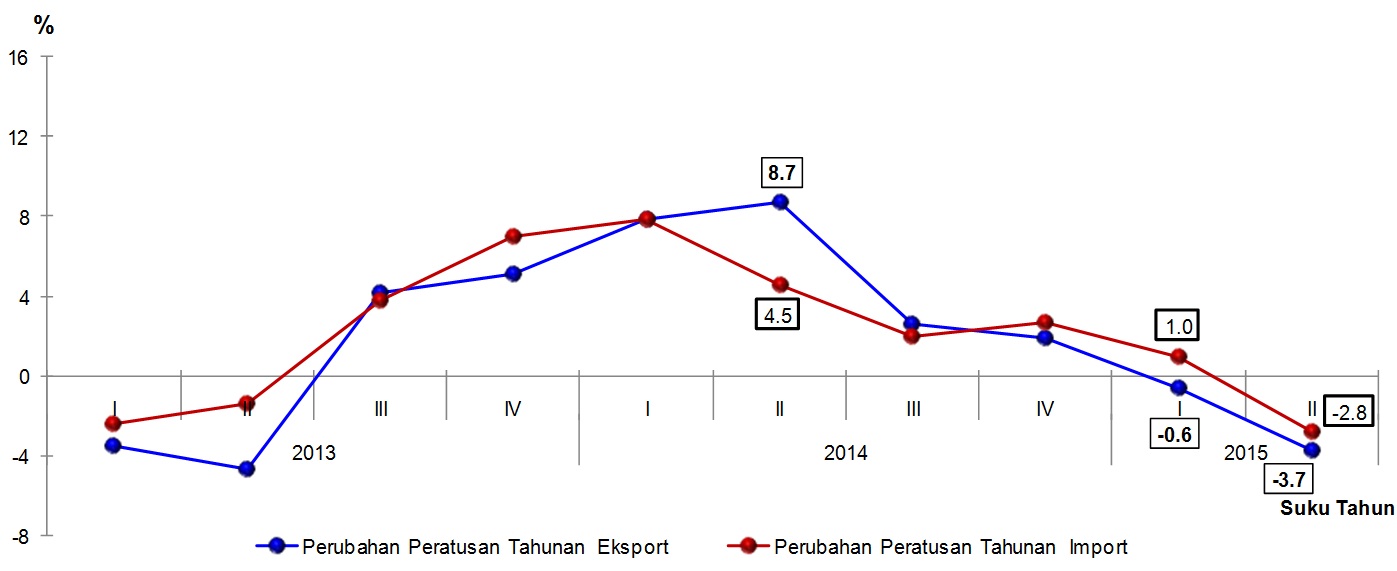
Chart 7: Exports & Imports - Annual Percentage Change
|
Exports dropped further to negative 3.7 per cent reflected by the subdued performance in exports of goods and services. Meanwhile, Imports also posted a negative growth of 2.8 per cent due to a contraction in imports of goods. |
Released By:
THE OFFICE OF CHIEF STATISTICIAN MALAYSIA
DEPARTMENT OF STATISTICS, MALAYSIA
13 August 2015
Contact person:
Norrita binti Amran
Public Relation Officer
Corporate and User Services Division
Department of Statistics, Malaysia
Tel : +603-8885 7942
Fax : +603-8888 9248
Email : norrita.amran@stats.gov.my
Subscribe
Newsletter
Subscribe to our newsletter and stay updated
For interviews, press statement and clarification to the media, contact:
Baharudin Mohamad
Public Relation Officer
Email: baharudin[at]dosm.gov.my
Phone: 03 8090 4681
Not found what you looking for? Request data from us, through
Go to eStatistik
Email: data[at]dosm.gov.my
Phone: 03 8885 7128 (data request)


