
Gross Domestic Product
- Home
- Statistics
- Economy
- National Accounts
- Gross Domestic Product
Gross Domestic Product Fourth Quarter 2015
Gross Domestic Product Third Quarter of 2015 13 August 2015
Gross Domestic Product Second Quarter of 2015 15 May 2015
Gross Domestic Product First Quarter Of 2015 12 February 2015
Gross Domestic Product Fourth Quarter Of 2014 16 May 2014
GDP BY STATES 2005-2013 16 May 2014
GDP BY STATES 2005-2013 Show all release archives
Overview
In the fourth quarter of 2015, Malaysia’s economy expanded at 4.5 per cent as compared to 4.7 per cent in the third quarter of 2015. On a quarter-on-quarter seasonally adjusted, the economy increased 1.5 per cent.
For year 2015, Malaysia’s economy grew 5.0 per cent (2014: 6.0%) with a value added stood at RM1,062.6 billion at constant prices and RM1,156.9 billion at current prices.
| PERCENTAGE CHANGE FROM CORRESPONDING QUARTER OF PRECEDING YEAR | ||||||||
| 2014 | 2015 | Q3 2014 | Q4 2014 | Q1 2015 | Q2 2015 | Q3 2015 | Q4 2015 | |
| GDP | 6.0 | 5.0 | 5.6 | 5.7 | 5.6 | 4.9 | 4.7 | 4.5 |
| PERCENTAGE CHANGE FROM PRECEDING QUARTER | ||||||||
| Seasonally Adjusted GDP | 0.8 | 1.8 | 1.2 | 1.1 | 0.7 | 1.5 | ||
Chart 1: GDP - Value Added and Annual Percentage Change

|
Chart 2: Services - Value Added and Annual Percentage Change
|
Services sector expanded at a faster pace of 5.0 per cent from 4.4 per cent in the preceding quarter. The performance of Services sector was underpinned by Wholesale & Retail Trade which advanced to 6.5 per cent. Information & Communication remained resilient by posting a growth of 9.2 per cent. Meanwhile, Transportation & Storage rose to 6.0 per cent following a better momentum in freight and passenger segments. |
|
|
Chart 3: Manufacturing - Value Added and Annual Percentage Change
|
Manufacturing sector increased further to 5.0 per cent (Q3 2015: 4.8%). As the key driver in Manufacturing, Electrical, Electronic & Optical products posted a sturdy growth at 10.5 per cent reflecting a higher momentum in consumer electronics and medical equipment products. Non-metallic Mineral products, Basic Metal & Fabricated Metal products rose to 4.7 per cent in line with an expansion in Construction sector. |
|
|
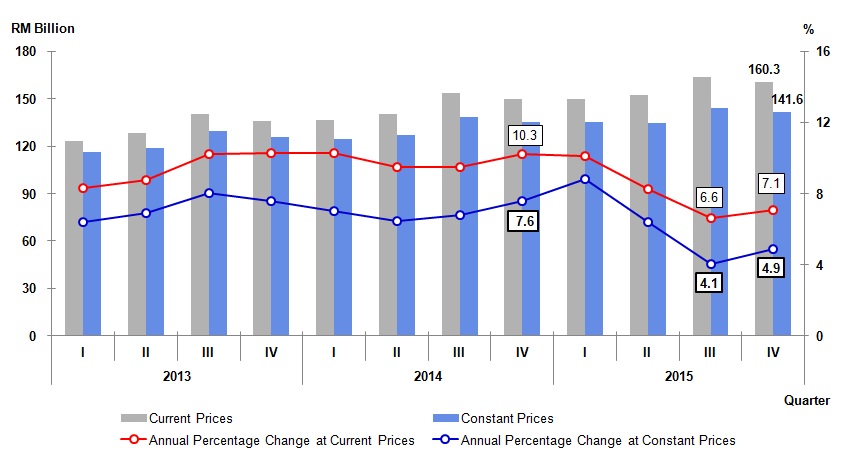
Chart 4: Construction - Value Added and Annual Percentage Change
|
Construction sector grew 7.4 per cent (Q3 2015: 9.9%). Civil Engineering posted an impressive growth of 20.4 per cent which was mainly geared by oil & gas and transportation related projects. Furthermore, Residential Buildings improved to 5.7 per cent from 5.2 per cent in the preceding quarter. |
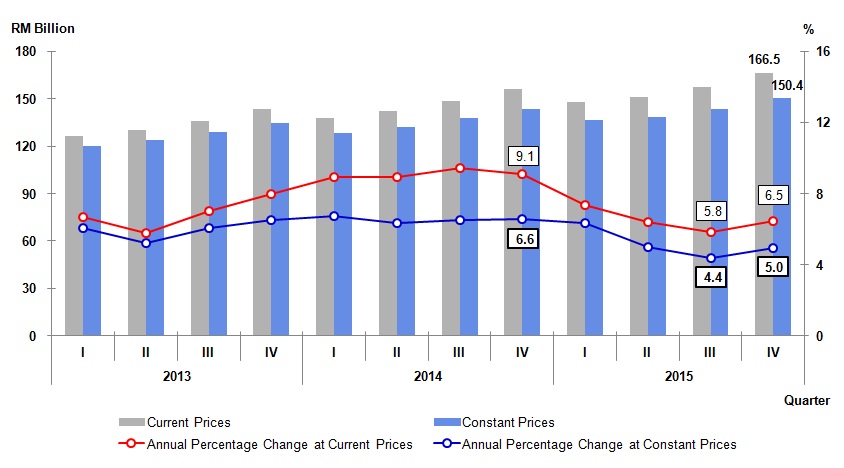
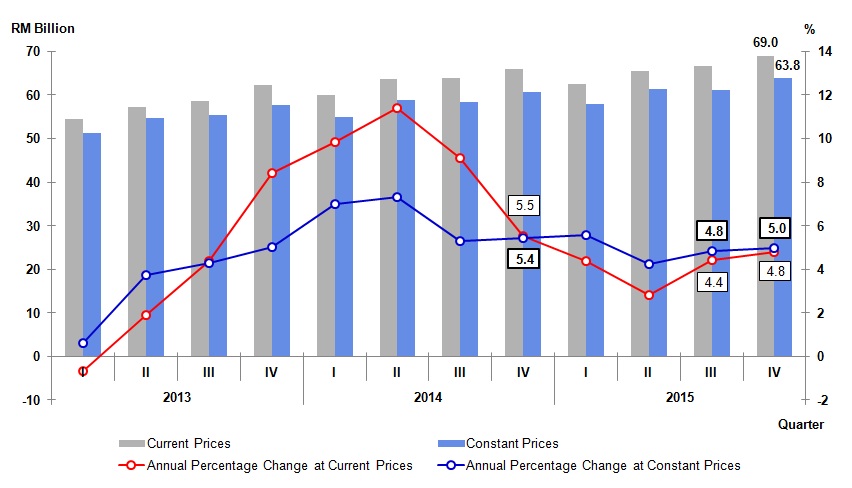
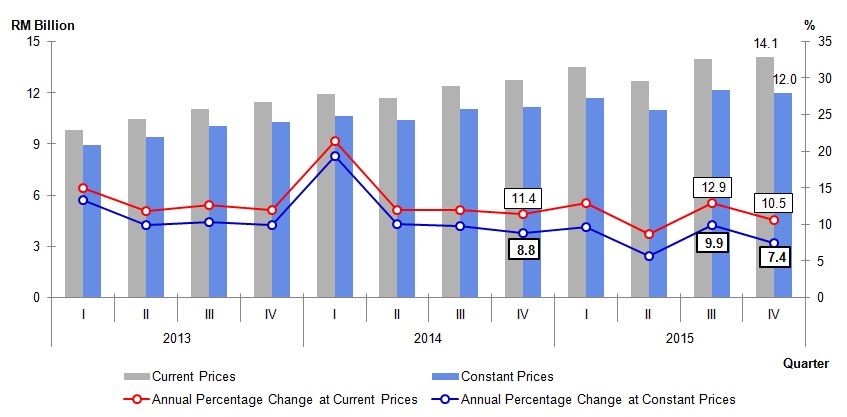
Chart 5: Private Final Consumption Expenditure – Value and Annual Percentage Change
Private Final Consumption Expenditure increased 4.9 per cent (Q3 2015: 4.1%). The momentum was impelled by the better growth in consumption of transportation, food & beverages and communication.
|
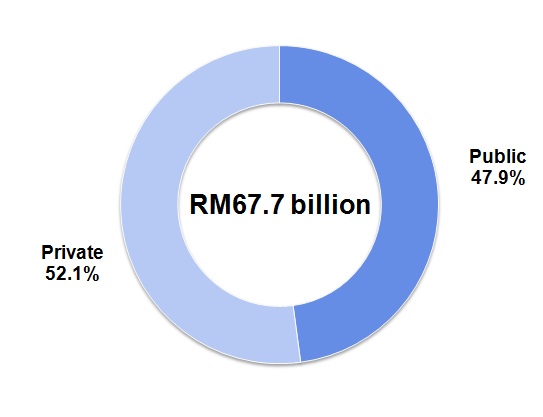
Chart 6: GFCF – Value and Percentage Share at Constant 2010 prices
|
Gross Fixed Capital Formation (GFCF) eased to 2.8 per cent (Q3 2015: 4.2%). The moderation of GFCF was due to the decline in Machinery & Equipment (Q4 2015: -0.1%) and slower momentum in Structure at 5.1 per cent (Q3 2015: 7.0%). The momentum of GFCF was induced by Private sector which grew 5.0 per cent. Public sector slipped to a marginal growth of 0.4 per cent in this quarter. |
|
|
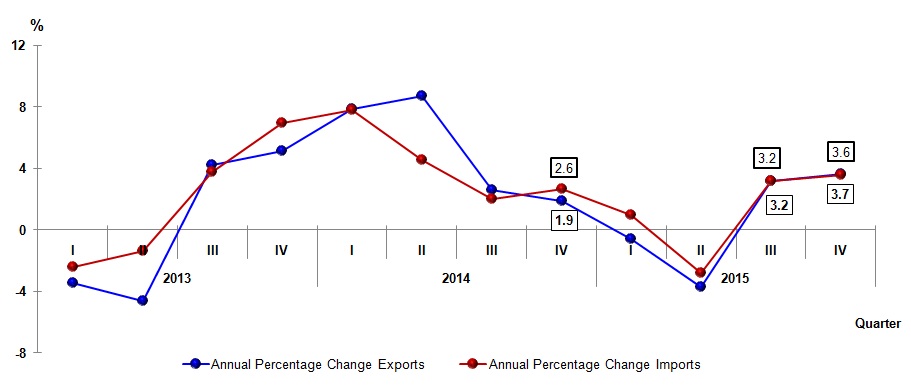
Chart 7: Exports & Imports - Annual Percentage Change
|
Exports augmented to 3.7 per cent (Q3 2015: 3.2%). Imports improved to 3.6 per cent in this quarter (Q3 2015: 3.2%). |
Released By:
THE OFFICE OF CHIEF STATISTICIAN MALAYSIA
DEPARTMENT OF STATISTICS, MALAYSIA
18 February 2016
Contact person:
Ho Mei Kei
Public Relation Officer
Corporate and User Services Division
Department of Statistics, Malaysia
Tel : +603-8885 7942
Fax : +603-8888 9248
Email : mkho@stats.gov.my
Subscribe
Newsletter
Subscribe to our newsletter and stay updated
For interviews, press statement and clarification to the media, contact:
Baharudin Mohamad
Public Relation Officer
Email: baharudin[at]dosm.gov.my
Phone: 03 8885 7942
Not found what you looking for? Request data from us, through
Go to eStatistik
email to data[at]dosm.gov.my
call 03 8885 7128 (data request)


