Overview
The statistics presented are using GDP base year 2010.
Malaysia’s economy remained resilient in first quarter of 2015 by registering a growth of 5.6 per cent. GDP in current prices amounted to RM277.2 billion in this quarter. In constant 2010 prices, GDP registered a value of RM254.4 billion.
On a quarter-on-quarter seasonally adjusted, the economy grew at 1.2 per cent.
Table 1: GDP at Constant 2010 prices
| PERCENTAGE CHANGE FROM CORRESPONDING QUARTER OF PRECEDING YEAR |
| |
Q114 |
Q214 |
Q314 |
Q414 |
Q115 |
| GDP |
6.3 |
6.5 |
5.6 |
5.7 |
5.6 |
| PERCENTAGE CHANGE FROM PRECEDING QUARTER |
| Seasonally Adjusted GDP |
1.4 |
1.6 |
0.8 |
1.8 |
1.2 |
Chart 1: GDP - Value Added and Annual Percentage Change
.jpg)
|
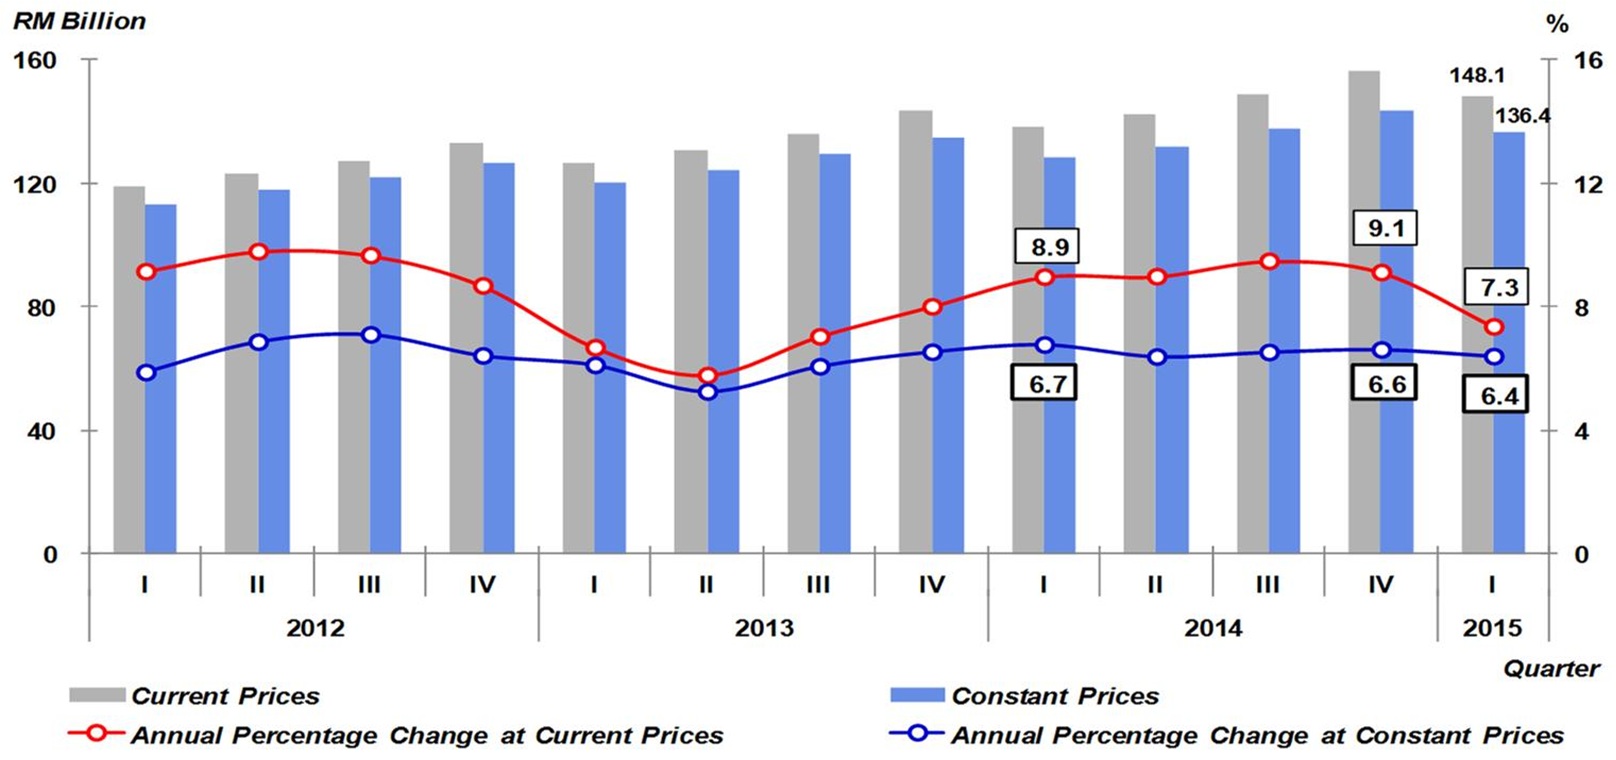
Chart 2: Services - Value Added and Annual Percentage Change
|
|
Services sector recorded a steady growth of 6.4 per cent. The growth was mainly led by Wholesale & Retail Trade largely spearheaded by Retail (10.7%) and Wholesale (9.6%). Information & Communication remained robust by posting a growth of 9.6 per cent, supported by telecommunication and computer services. Real Estate & Business Services grew at 7.6 per cent backed by professional activities.
|
| |
|
|
|
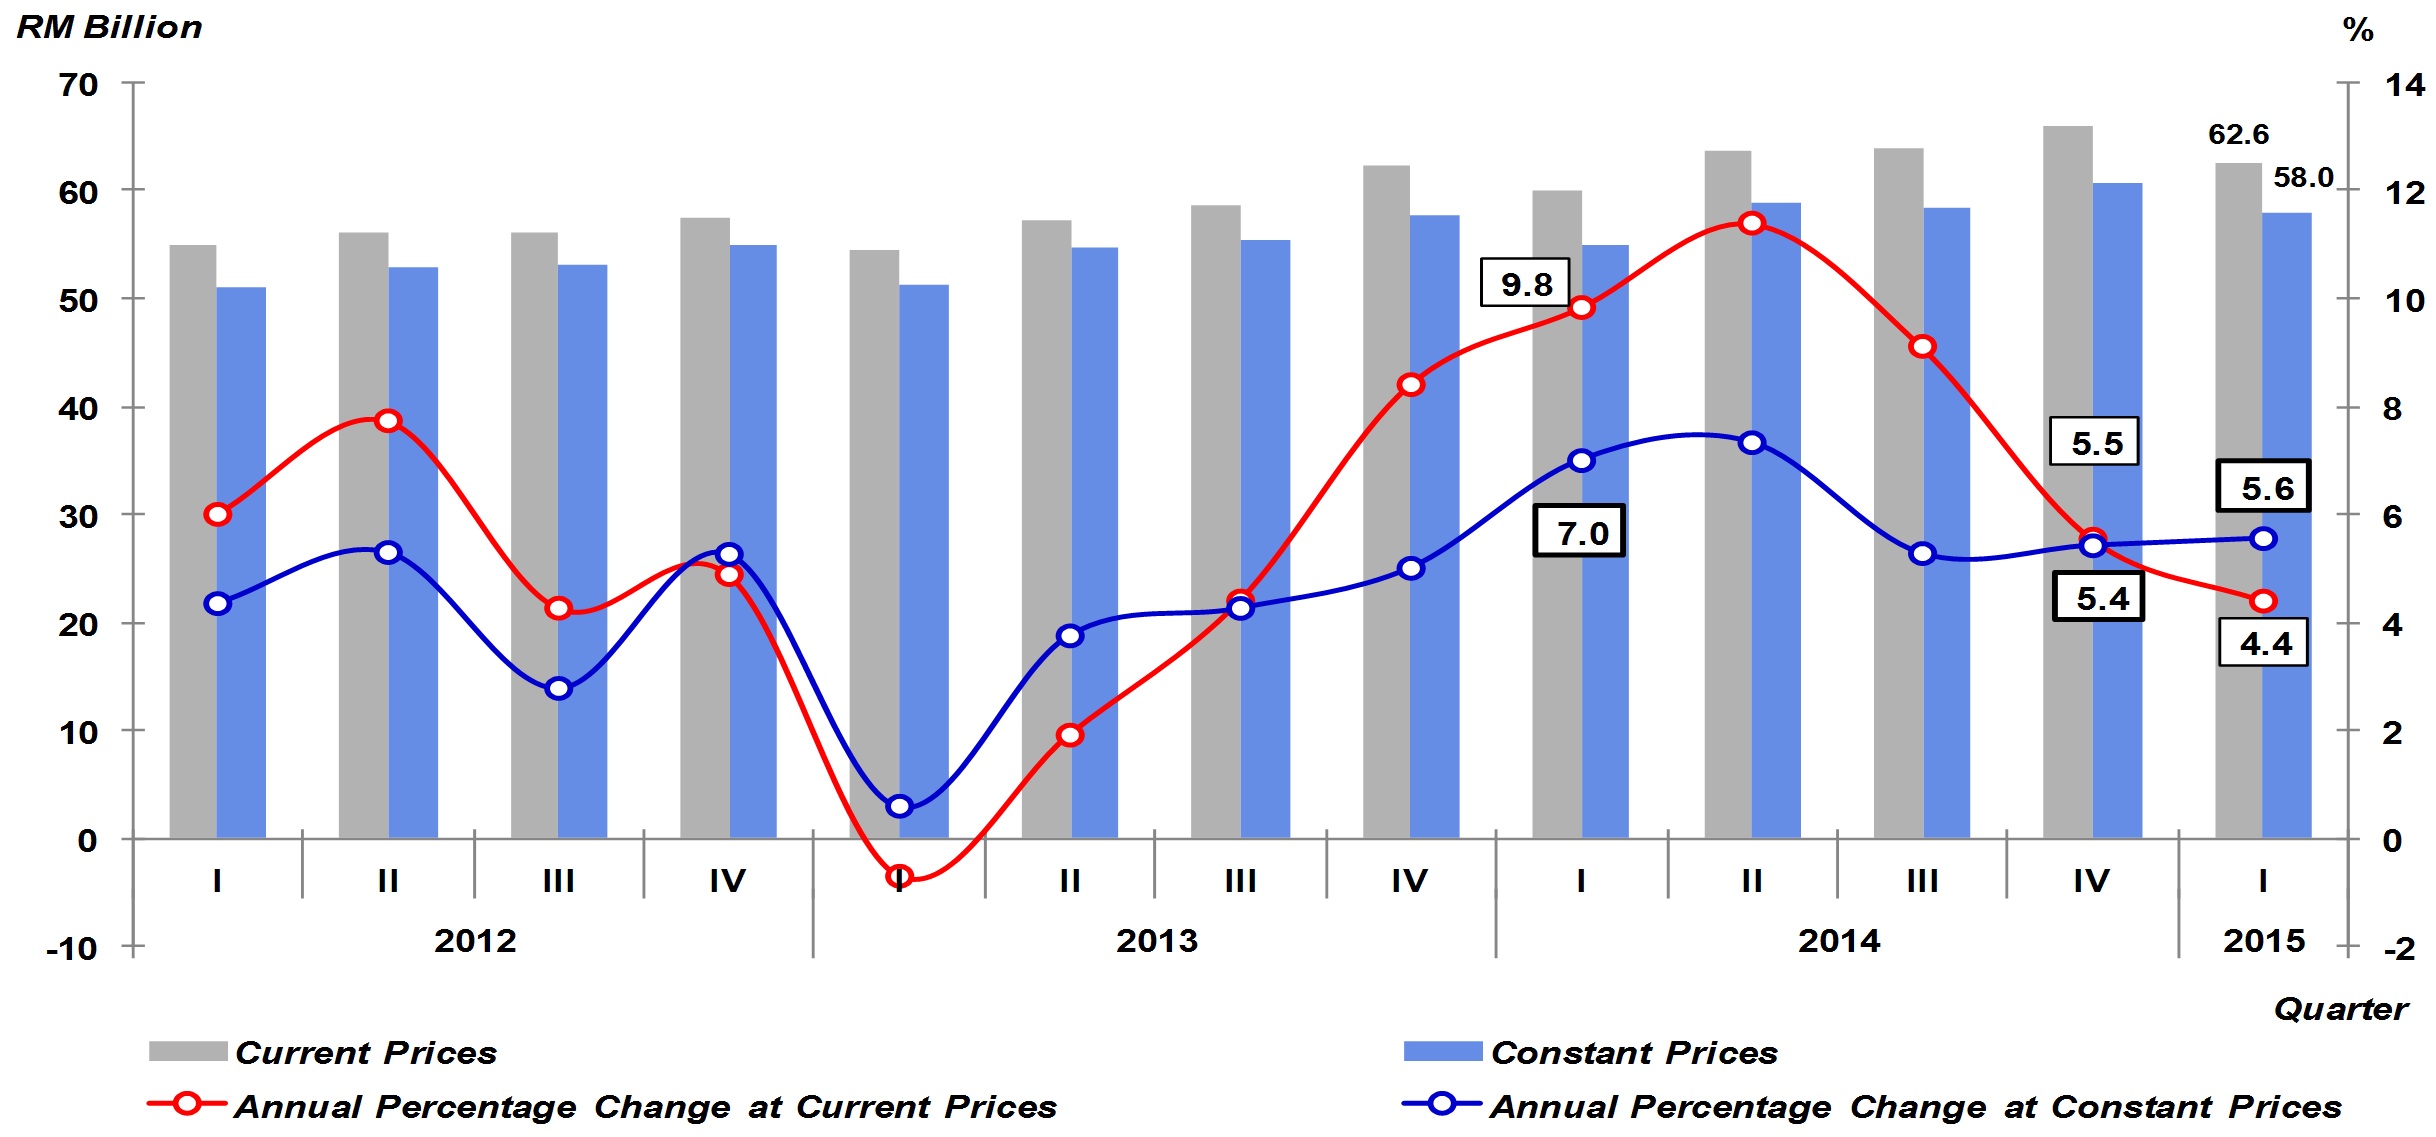
Chart 3: Manufacturing - Value Added and Annual Percentage Change
|
|
Manufacturing sector rose to 5.6 per cent from 5.4 per cent in the previous quarter. The growth was driven by Electrical, Electronic & Optical products (9.3%), impelled by production of domestic oriented industries such as consumer electronics and communication equipment. Petroleum, Chemical, Rubber & Plastic products picked-up to 4.6 per cent and Transport Equipment, Other Manufacturing & Repair registered a better growth of 6.7 per cent.
|
| |
|
|
|
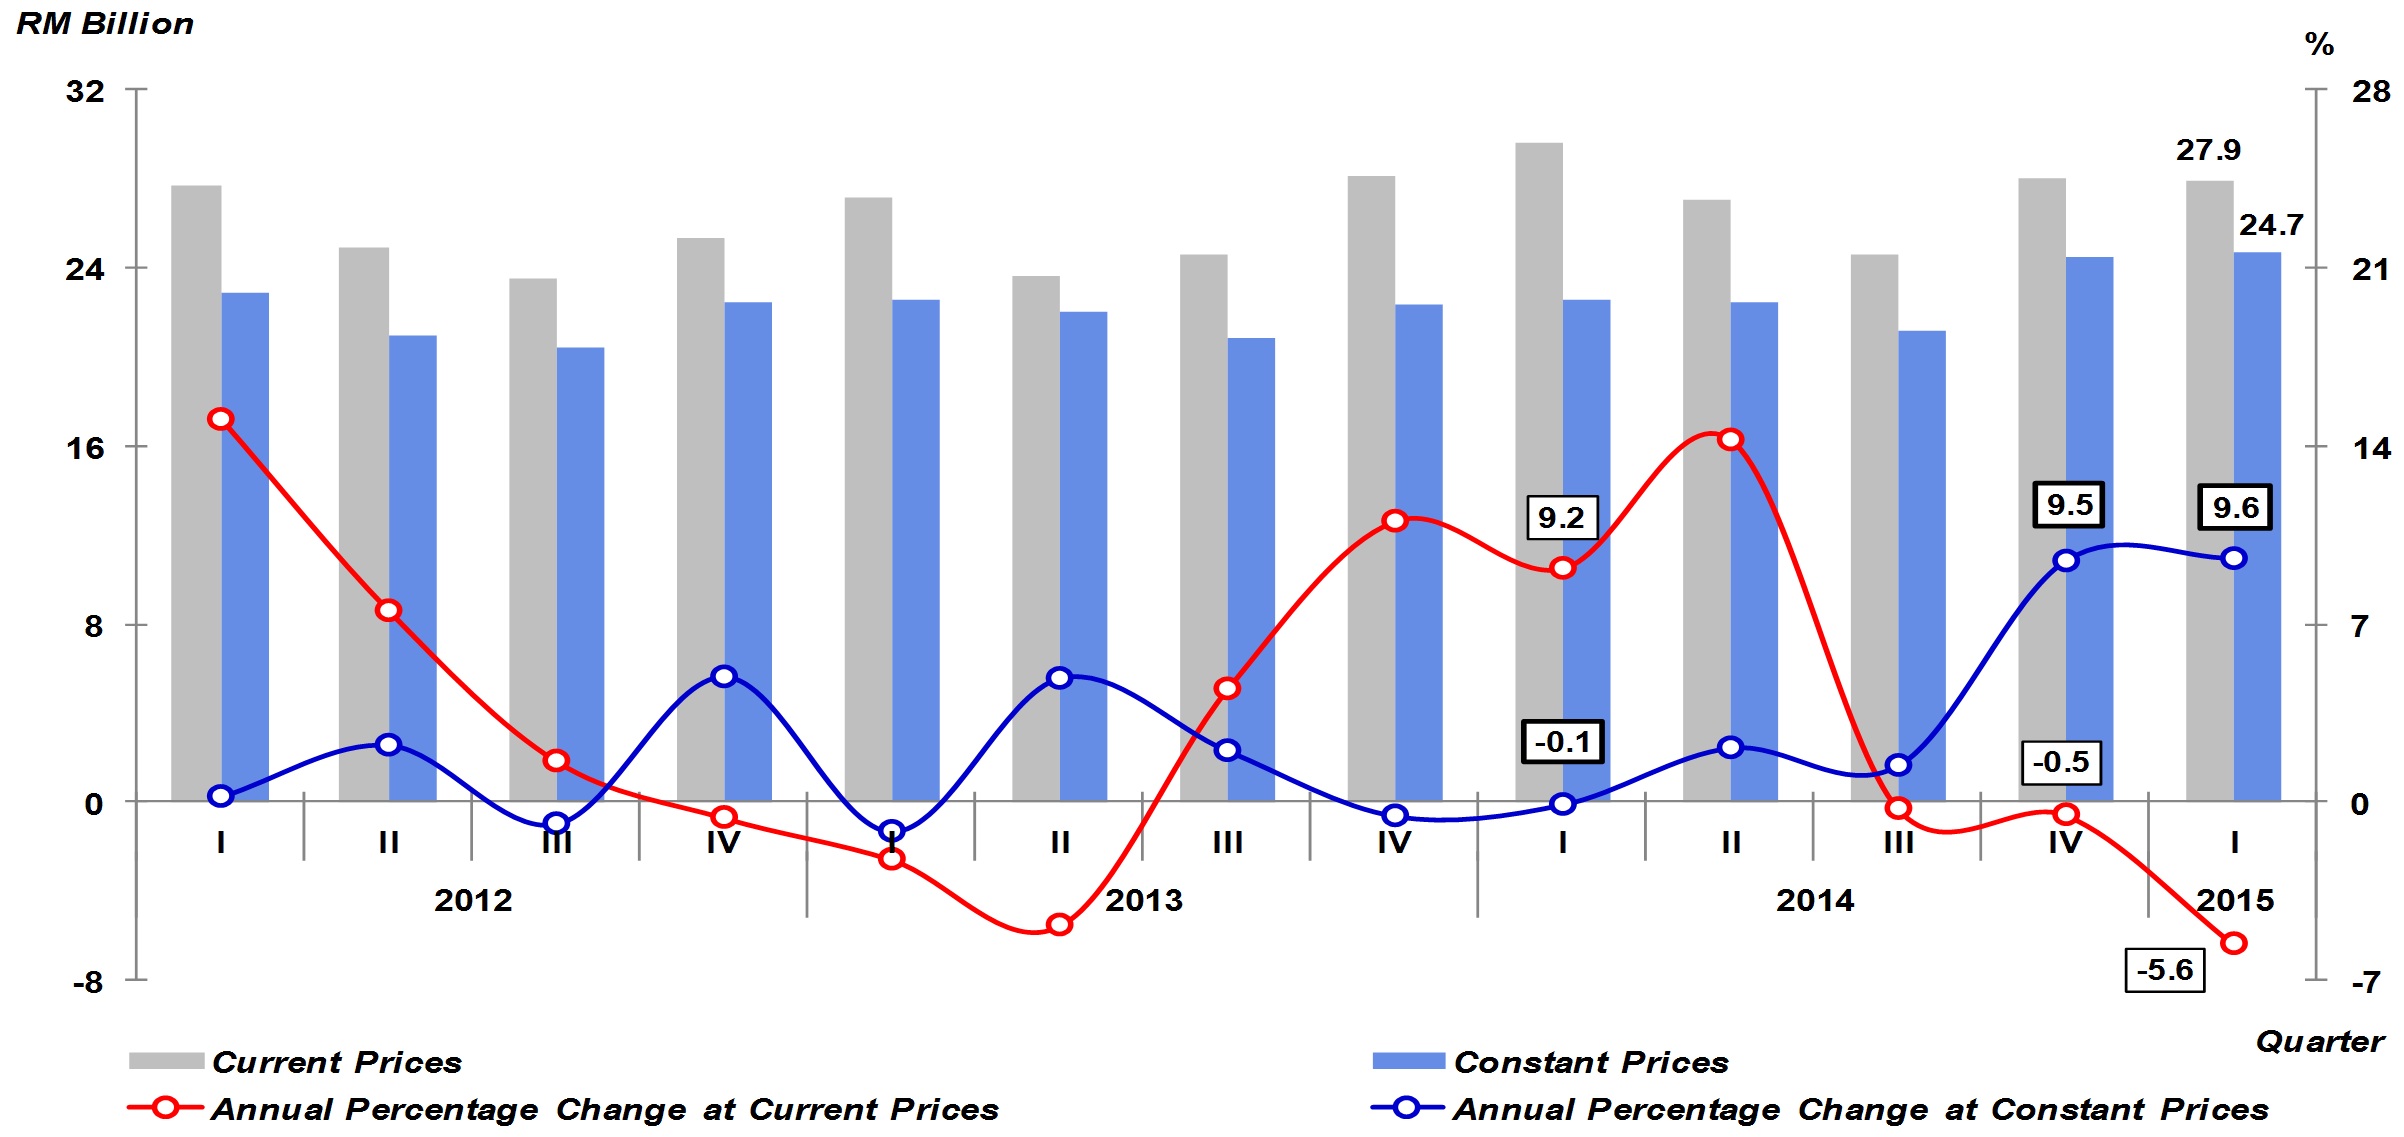
Chart 4: Mining & Quarrying - Value Added and Annual Percentage Change
|
|
Mining and Quarrying sector posted a strong growth of 9.6 per cent. The growth was primarily reflected by a double-digit increase in the production of crude oil. On the contrary, production of natural gas declined in this quarter.
|
Chart 5: Private Final Consumption Expenditure – Value and Annual Percentage Change
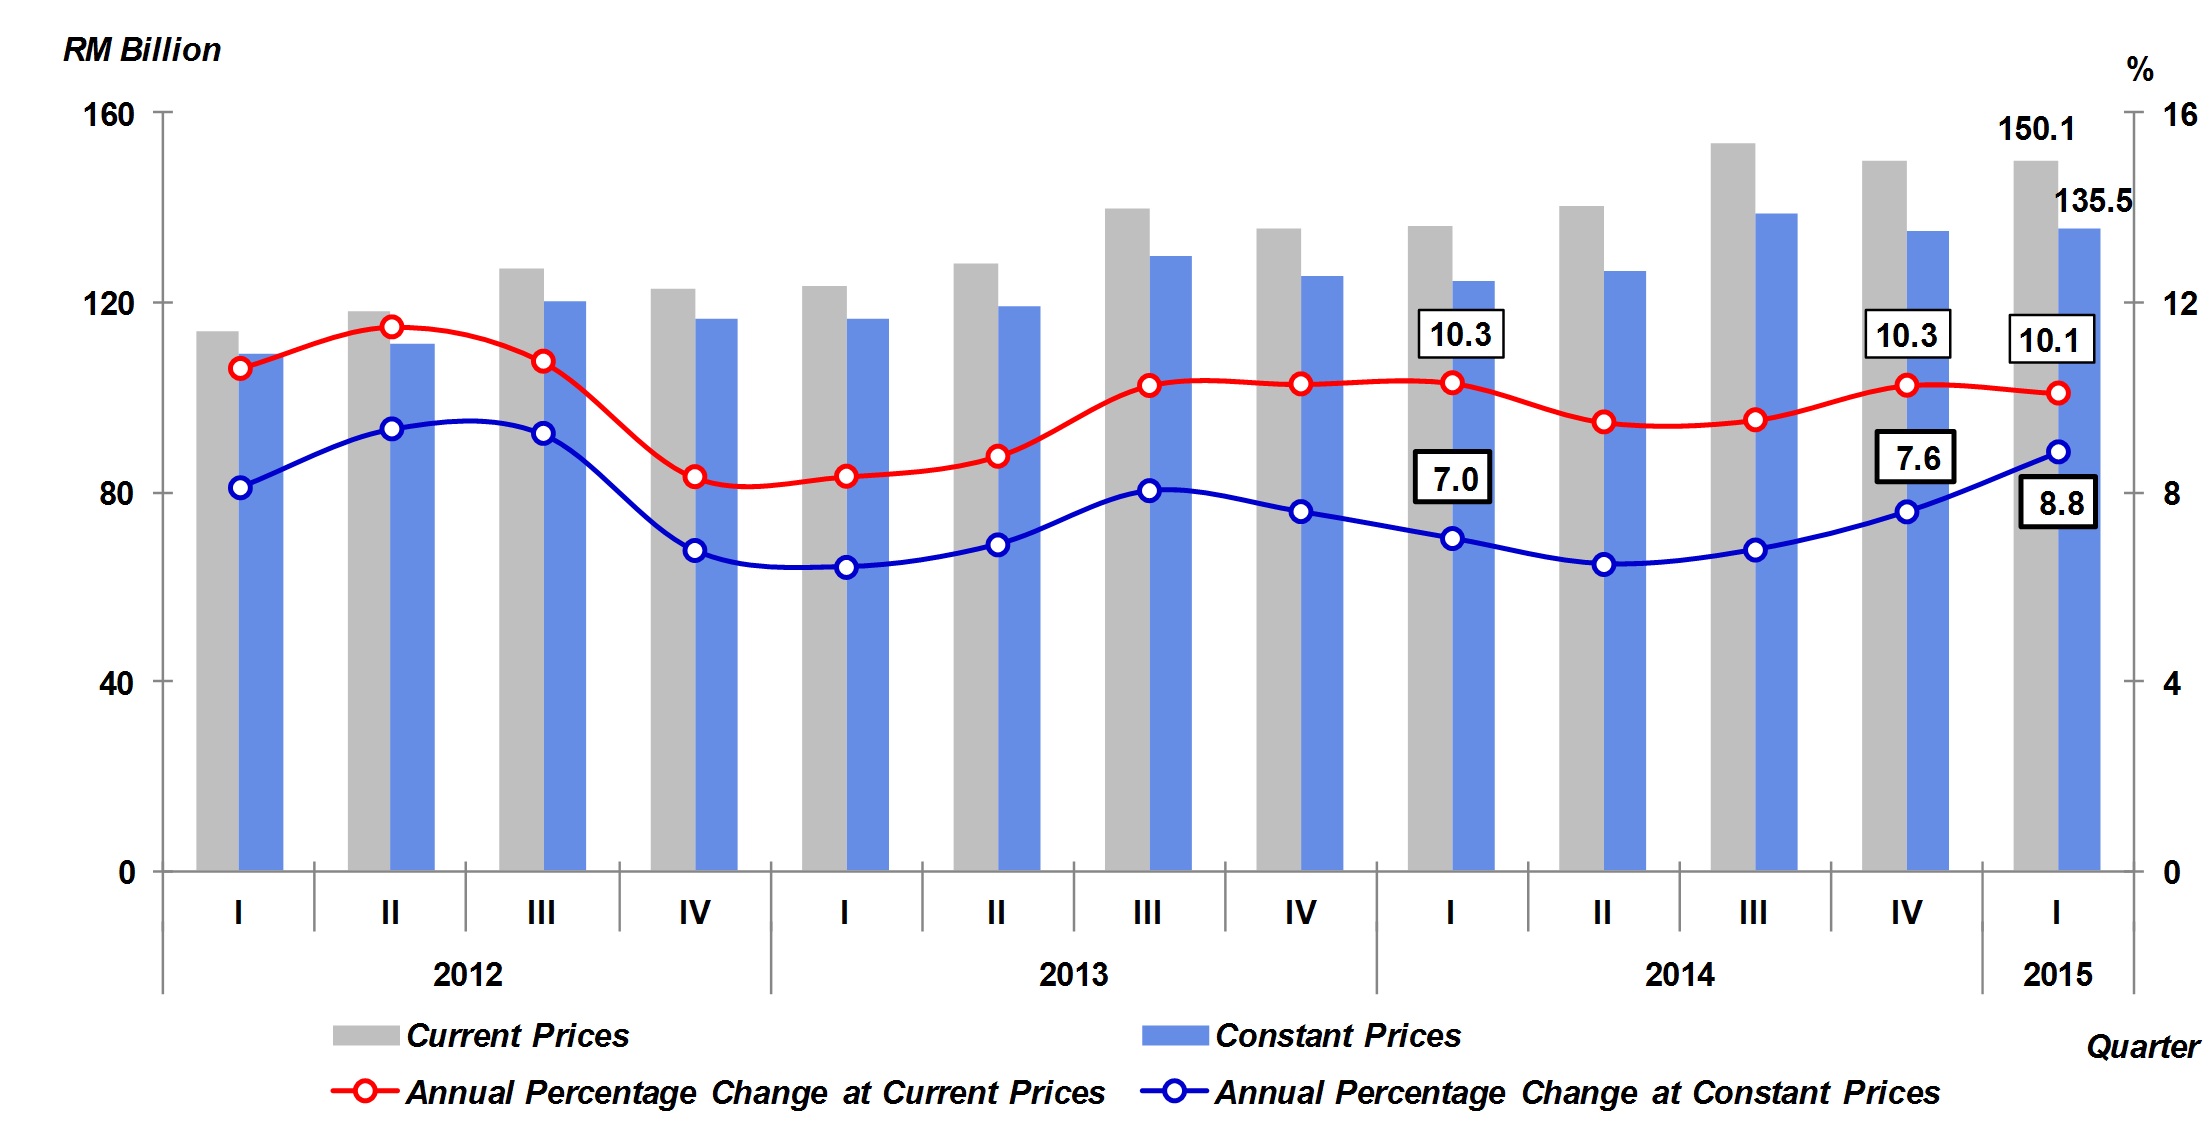
On the demand side, Private Final Consumption Expenditure elevated to 8.8 per cent (Q4 2014: 7.6%). Household consumption was high on food & beverages, transport and communication.
|
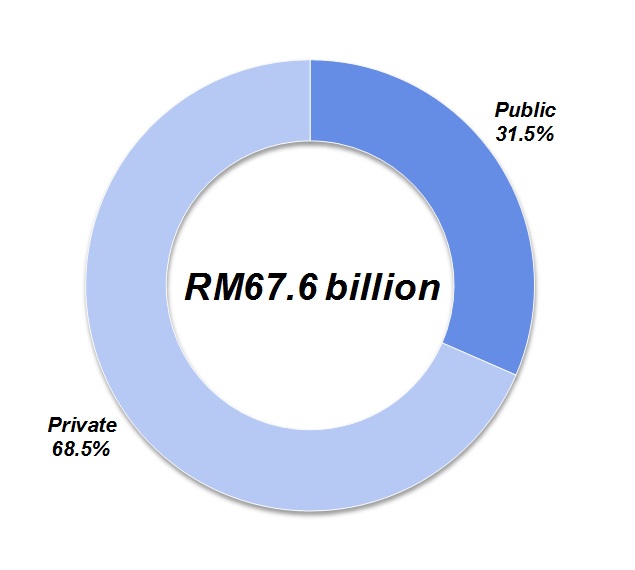
Chart 6: GFCF – Value and Percentage Share at Constant 2010 prices
|
|
Gross Fixed Capital Formation (GFCF) ascended to 7.9 per cent (Q4 2014: 4.3%) which was induced by the robust performance of Structure (9.9%) and a rebound in Machinery & Equipment (5.8%). The expansion in GFCF was spearheaded by Private sector (share: 68.5%) with a growth of 11.7 per cent.
|
|
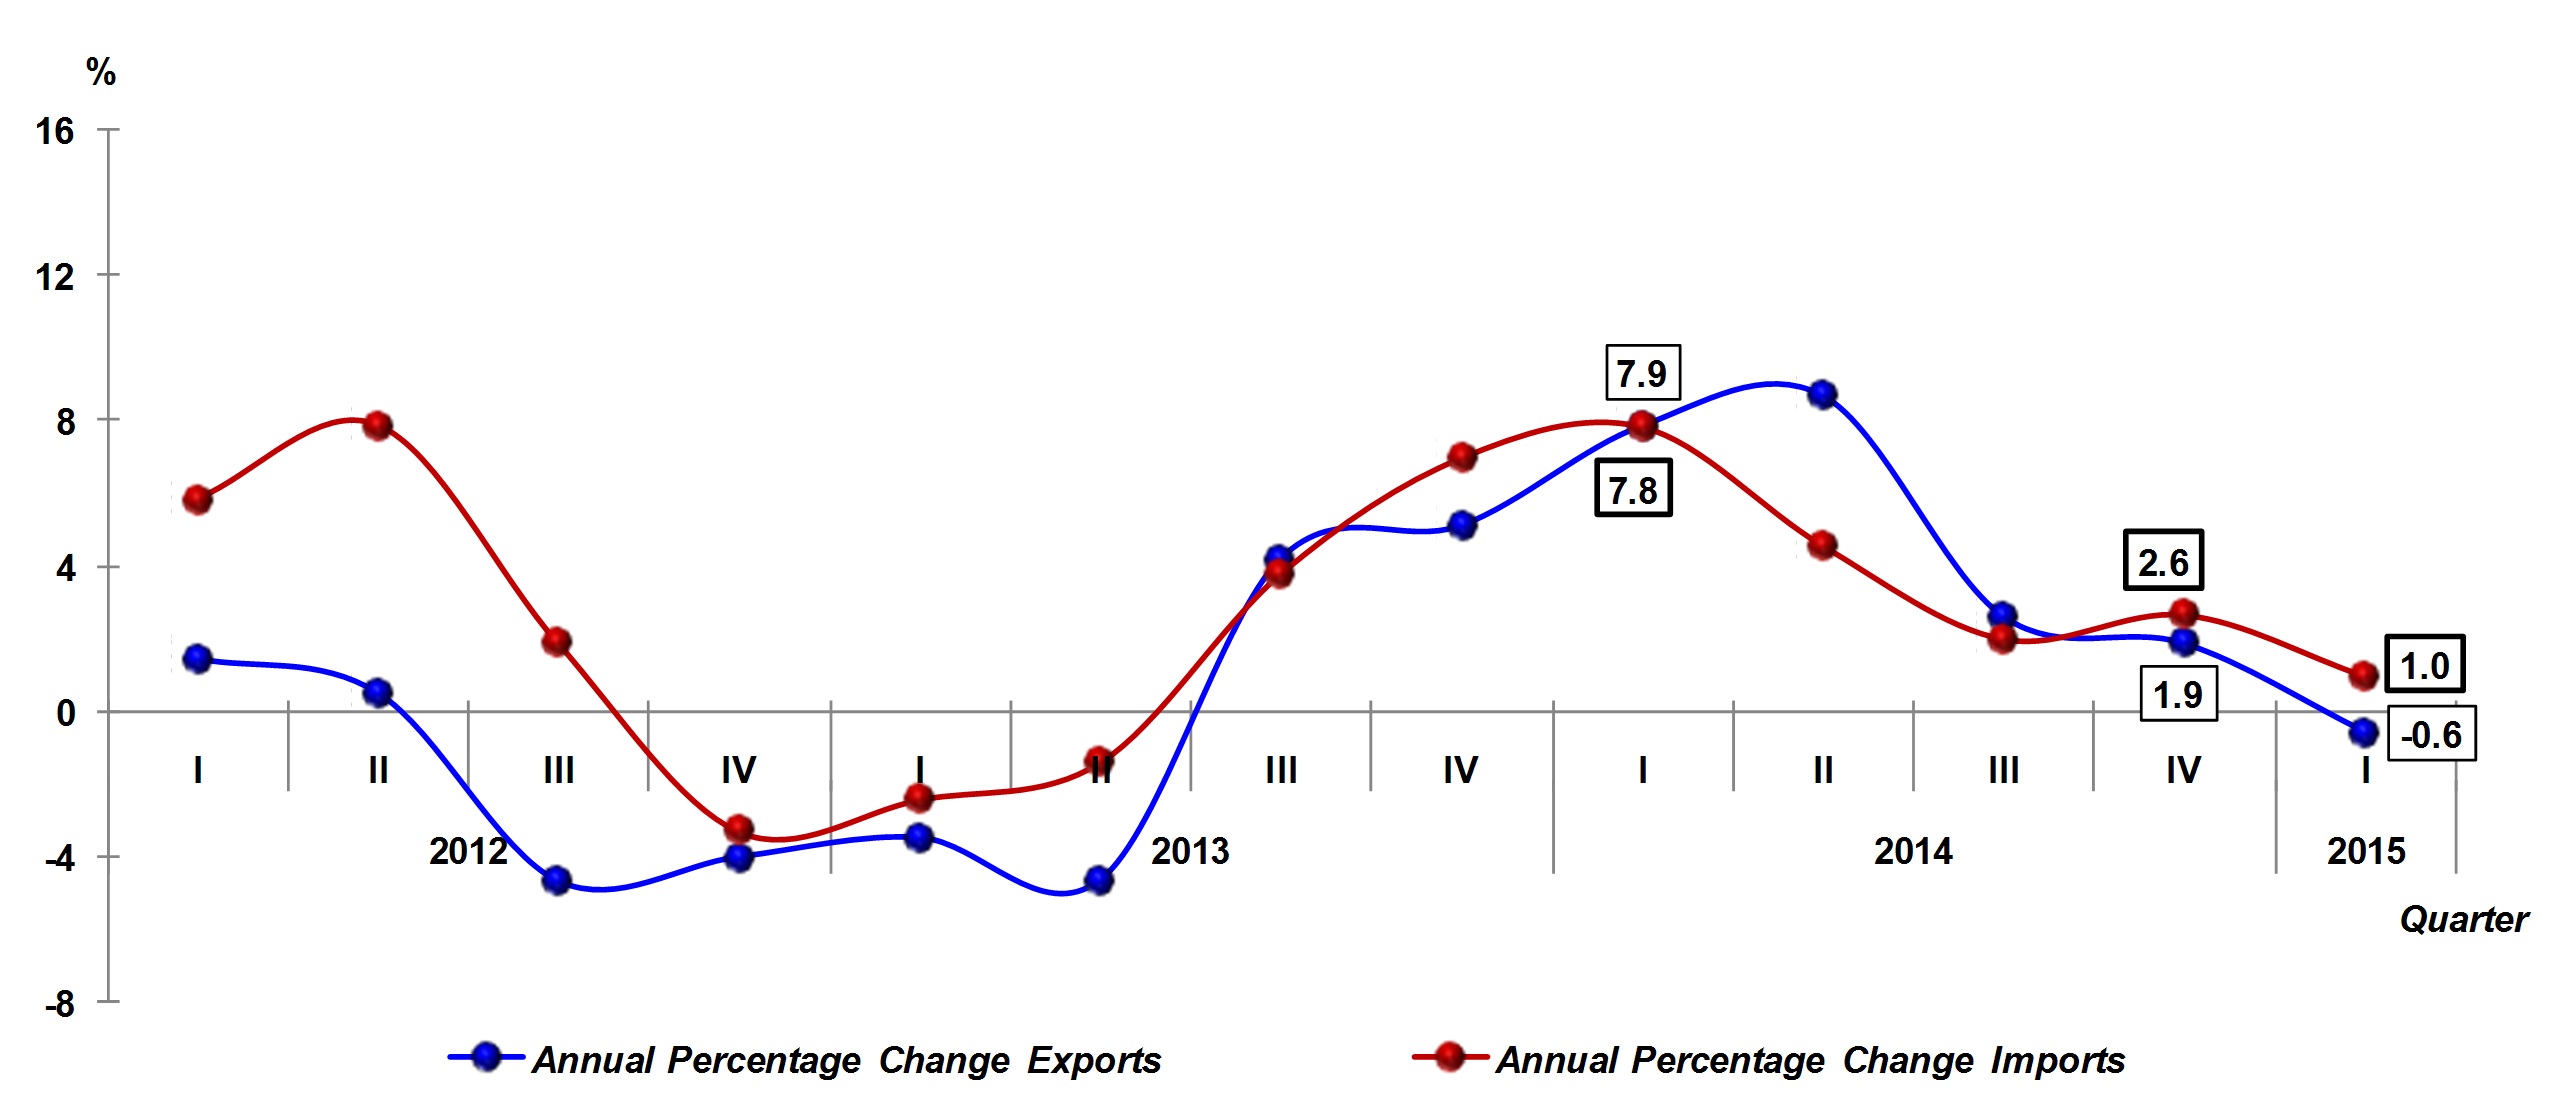
Chart 7: Exports & Imports - Annual Percentage Change
|
|
Exports declined at 0.6 per cent due to the sluggish performance in the exports of services and moderation in exports of goods. Meanwhile, Imports eased to 1.0 per cent following a moderation in both imports of goods and services.
|
Released By:
THE OFFICE OF CHIEF STATISTICIAN MALAYSIA
DEPARTMENT OF STATISTICS, MALAYSIA
15 May 2015
Contact person:
Norrita binti Amran
Public Relation Officer
Corporate and User Services Division
Department of Statistics, Malaysia
Tel : +603-8885 7942
Fax : +603-8888 9248
Email : norrita.amran@stats.gov.my
Subscribe

Newsletter
Subscribe to our newsletter and stay updated

Follow Us
Follow our Facebook page and stay updated
Follow
For interviews, press statement and clarification to the media, contact:
Baharudin Mohamad
Public Relation Officer
Email: baharudin[at]dosm.gov.my
Phone: 03 8885 7942
Not found what you looking for? Request data from us, through
Go to eStatistik
email to data[at]dosm.gov.my
call 03 8885 7128 (data request)


